Hi all, In this post, we'll see how to integrate Prometheus with our already deployed fox-game project on Kubernetes (minikube).
Prometheus is an open-source systems monitoring and alerting toolkit. What it does is look for a metrics endpoint on your application and scrapes various metrics example number-of-CPUs, active connections, memory usage, etc.. which can then be further fed into other tools like Grafana for visuals rich dashboard or alert manager for alerting when certain thresholds get crossed.
Pre-requisites:
Deployments and services created on minikube (see my previous blog on how to do this)
If you want to start from this point, you can clone my fox-game repo and follow the below steps to quickly get started:
#My directory structure looks like this:
├── k8s
└── src
    ├── bg
    │   ├── BUTTONS
    │   └── ICONS
    └── pet
Then Go inside the k8s/ and run the following commands:
$ minikube start
$ minikube addons enable metrics-server

# To create deployments:
$ kubectl apply -f k8s/deployment.yaml
$ kubectl apply -f k8s/service.yaml

# To check creation of pods and services:
$ kubectl get pods
$ kubectl get svc

# You can also check from minikube dashboard. To launch minikube dashboard:
$ minikube dashboard
Once your Pod/Services are created follow the below steps.
Step 1: Create an ingress.yaml file.
What is Ingress?
Ingress exposes HTTP and HTTPS routes from outside the cluster to services within the cluster. Traffic routing is controlled by rules defined on the Ingress resource.
Here is a simple example where an Ingress sends all its traffic to one Service:
{ source: https://kubernetes.io/docs/concepts/services-networking/ingress/#what-is-ingress }
apiVersion: networking.k8s.io/v1
kind: Ingress
metadata:
  name: fox-game-ingress
spec:
  ingressClassName: nginx
  rules:
  - host: "raisethefox.com"
    http:
      paths:
      - path: /
        pathType: Prefix
        backend:
          service:
            name: fox-game-service
            port:
              number: 80
The
metadata.namefield defines the name of the resourcefox-game-ingress.In the
spec.rulesfield, we define a host with a domain nameraisethefox.com.- When defining an Ingress resource, the
hostfield is required.
- When defining an Ingress resource, the
In the
pathsfield, we define path‑based rules:- The rule with the path
/instructs NGINX to distribute the requests with the/URI among the pods of the fox-game service, which is deployed with the namefox-game-servicein the cluster.
- The rule with the path
Both rules instruct NGINX to distribute the requests to
port 80of the corresponding service (theservicePortfield).If the
ingressClassNameis omitted, a default Ingress class should be defined.There are some ingress controllers, that work without the definition of a default
IngressClass. For example, the Ingress-NGINX controller can be configured with a flag--watch-ingress-without-class. It is recommended though, to specify the defaultIngressClass. (see more info here)
Step 2: Create an ingress-class.yaml file.
apiVersion: networking.k8s.io/v1
kind: IngressClass
metadata:
  name: nginx
spec:
  controller: nginx.org/ingress-controller
Step 3: Install nginx-controller in your cluster.
An Ingress Controller is a component in a Kubernetes cluster that configures an HTTP load balancer according to Ingress resources created by the cluster user.
You must have an Ingress controller to satisfy an Ingress. Only creating an Ingress resource has no effect.
$ helm repo add nginx-stable https://helm.nginx.com/stable
# helm repo add [NAME] [URL] [flags]

$ helm install main nginx-stable/nginx-ingress \
--set controller.watchIngressWithoutClass=true

# helm install [NAME] [CHART] [flags]
# Output
NAME: main
LAST DEPLOYED: Fri Mar 31 11:10:29 2023
NAMESPACE: default
STATUS: deployed
REVISION: 1
TEST SUITE: None
NOTES:
The NGINX Ingress Controller has been installed.
You can read about Helm commands here.
Step 4: Deploy Ingress and Ingress-class.
$ kubectl apply -f ingress-class.yaml
# output
ingressclass.networking.k8s.io/nginx created

$ kubectl apply -f ingress.yaml
# output
ingress.networking.k8s.io/fox-game-ingress created
Why are we using NGINX for integrating Prometheus?
Because the metrics Prometheus needs to collect have to be defined by ourselves in our application. Luckily for us, nginx provides various pre-defined metrics. You can read about them more here.
Step 5: After deploying ingress we need to check if we can access our application through ingress service:
$ kubectl get service

# NAME                            TYPE           CLUSTER-IP       EXTERNAL-IP   PORT(S)                      AGE
# fox-game-service                LoadBalancer   10.103.40.120    <pending>     6000:32177/TCP               82m
# kubernetes                      ClusterIP      10.96.0.1        <none>        443/TCP                      24d
# main-nginx-ingress-controller   LoadBalancer   10.107.235.249   <pending>     80:32450/TCP,443:30485/TCP   53m
Step 6: We'll need to port-forward this ingress controller to be able to view our application in the browser:
$ kubectl port-forward service/main-nginx-ingress-controller 9000:80
Step 7: Go to your browser and type http://raisethefox.com:9000 and you'll be able to see your application working.

Step 8: Now for the Prometheus part, we'll have to install Prometheus in our cluster:
$ helm repo add prometheus-community https://prometheus-community.github.io/helm-charts
$ helm install prometheus prometheus-community/prometheus
Step 9: To view the Prometheus dashboard:
minikube service prometheus-server

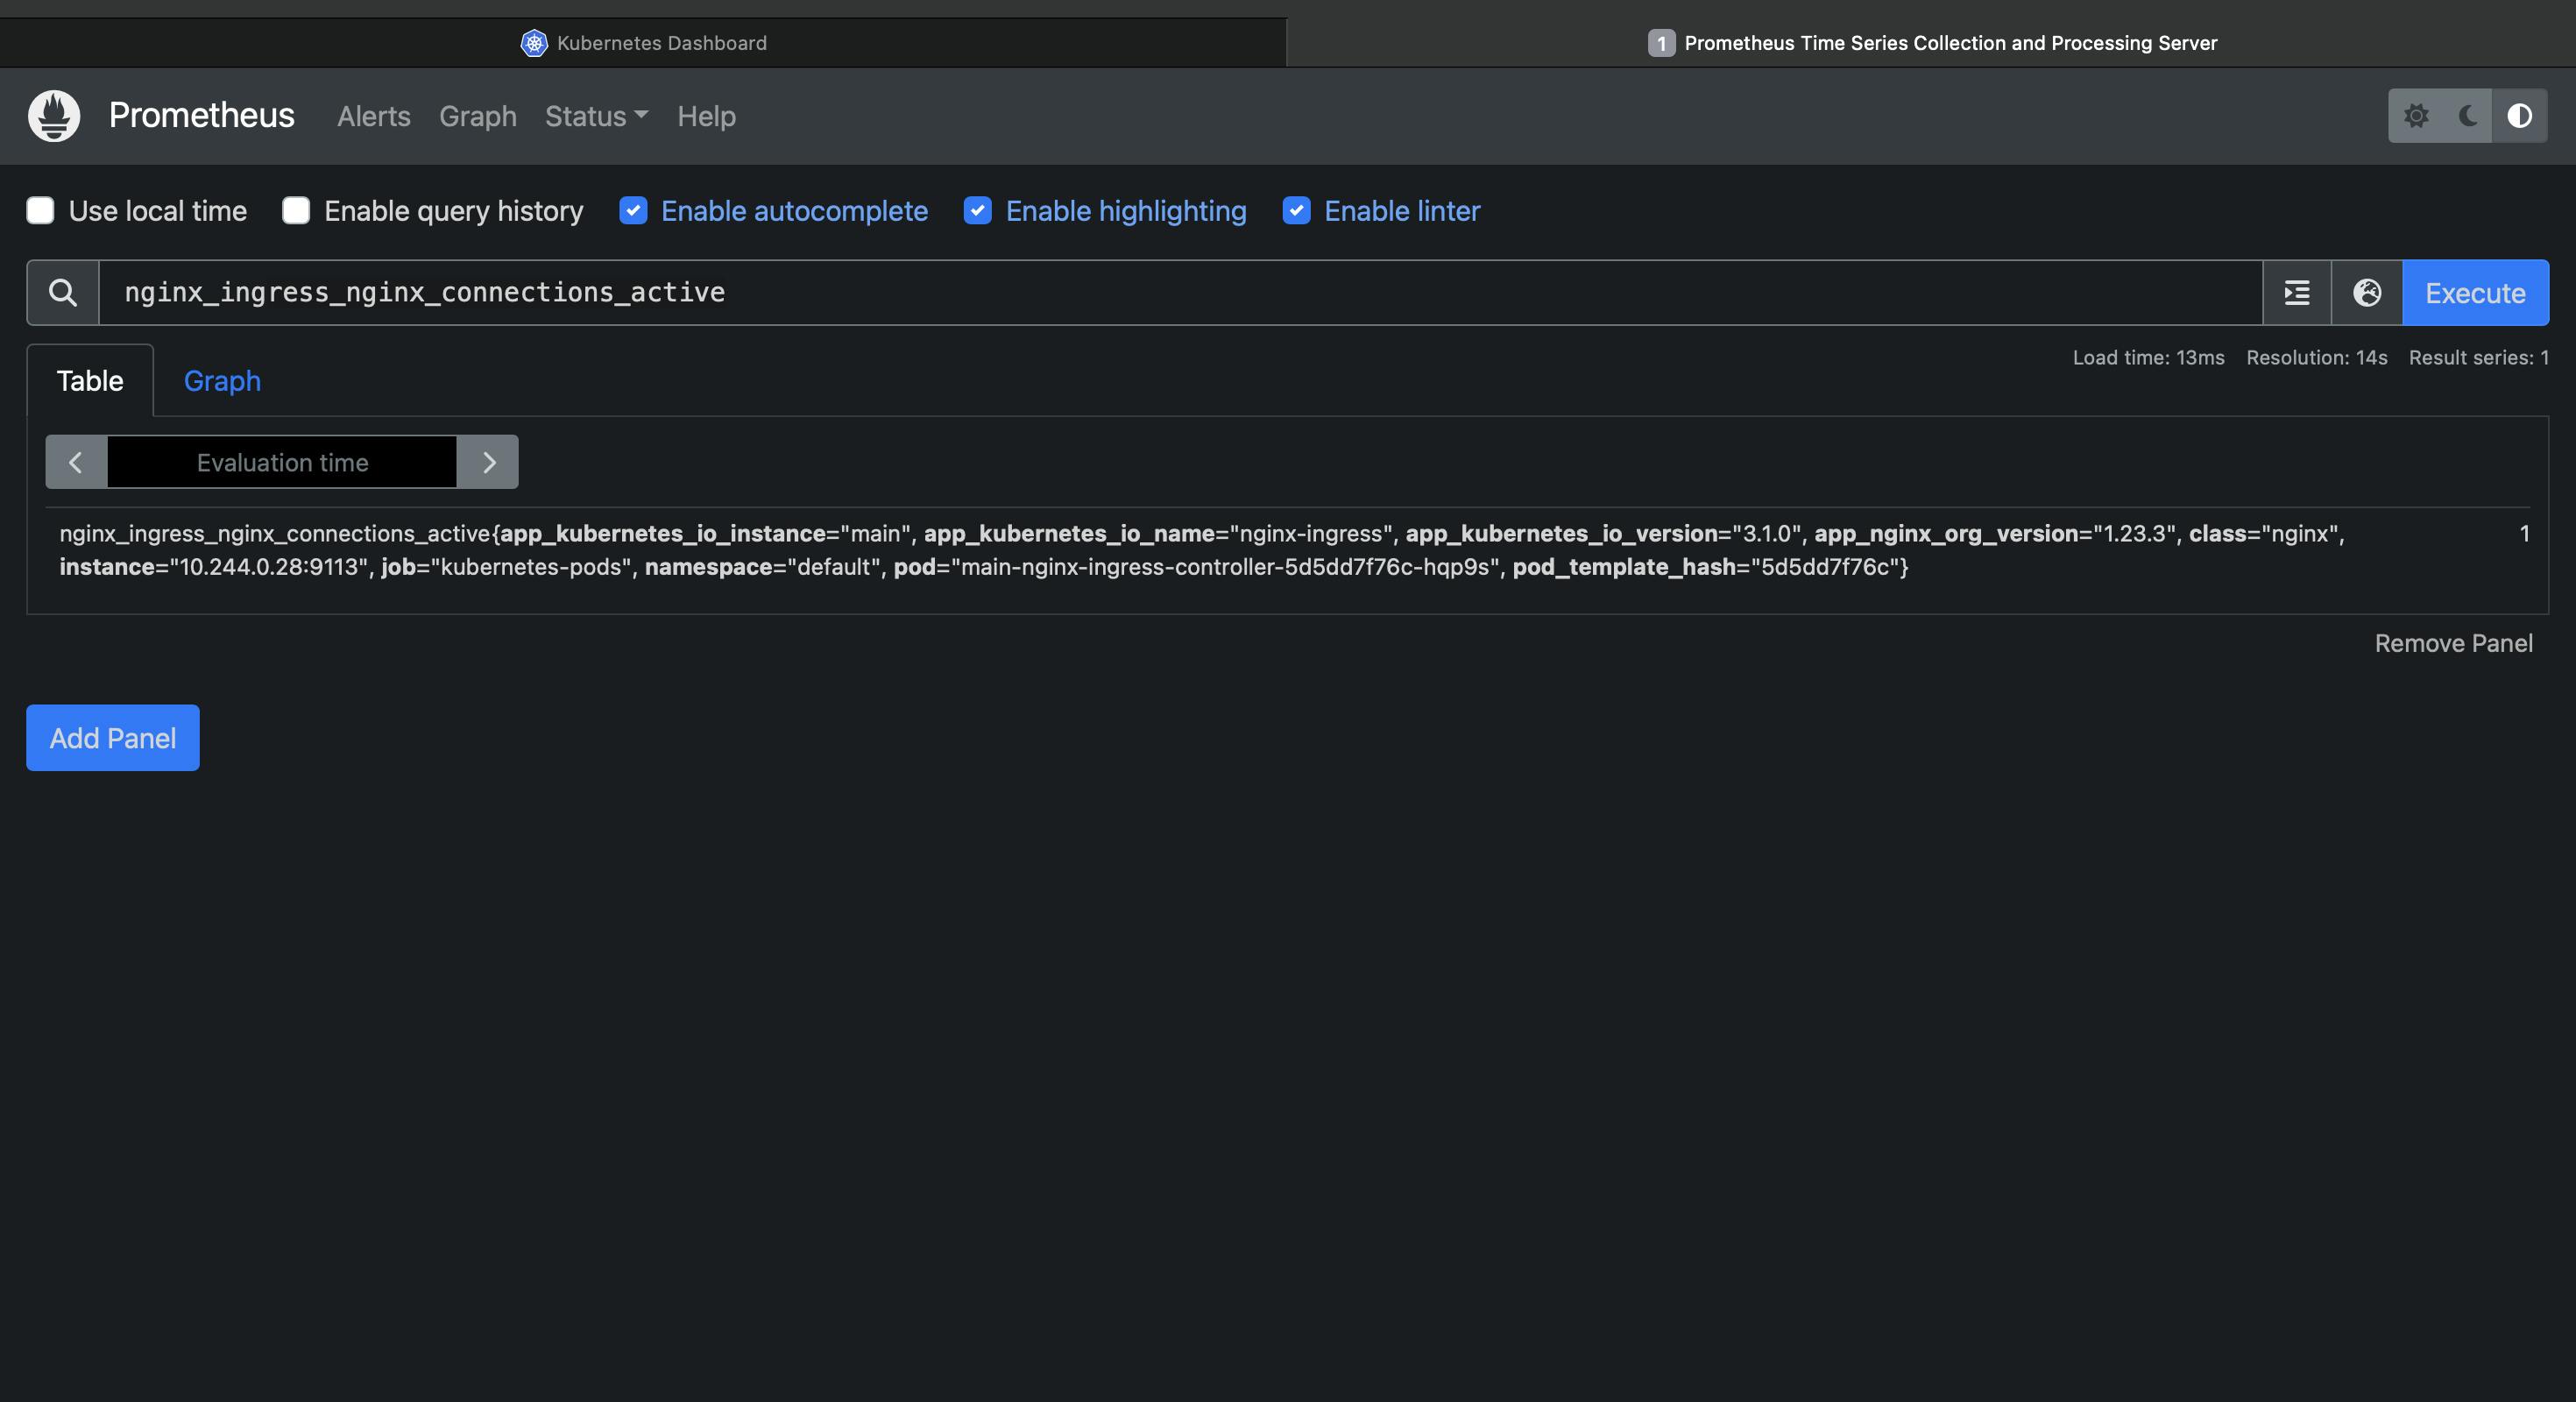
As you can see it shows the active connections to nginx ingress as '1' since we hit that endpoint when we accessed it in our browser.
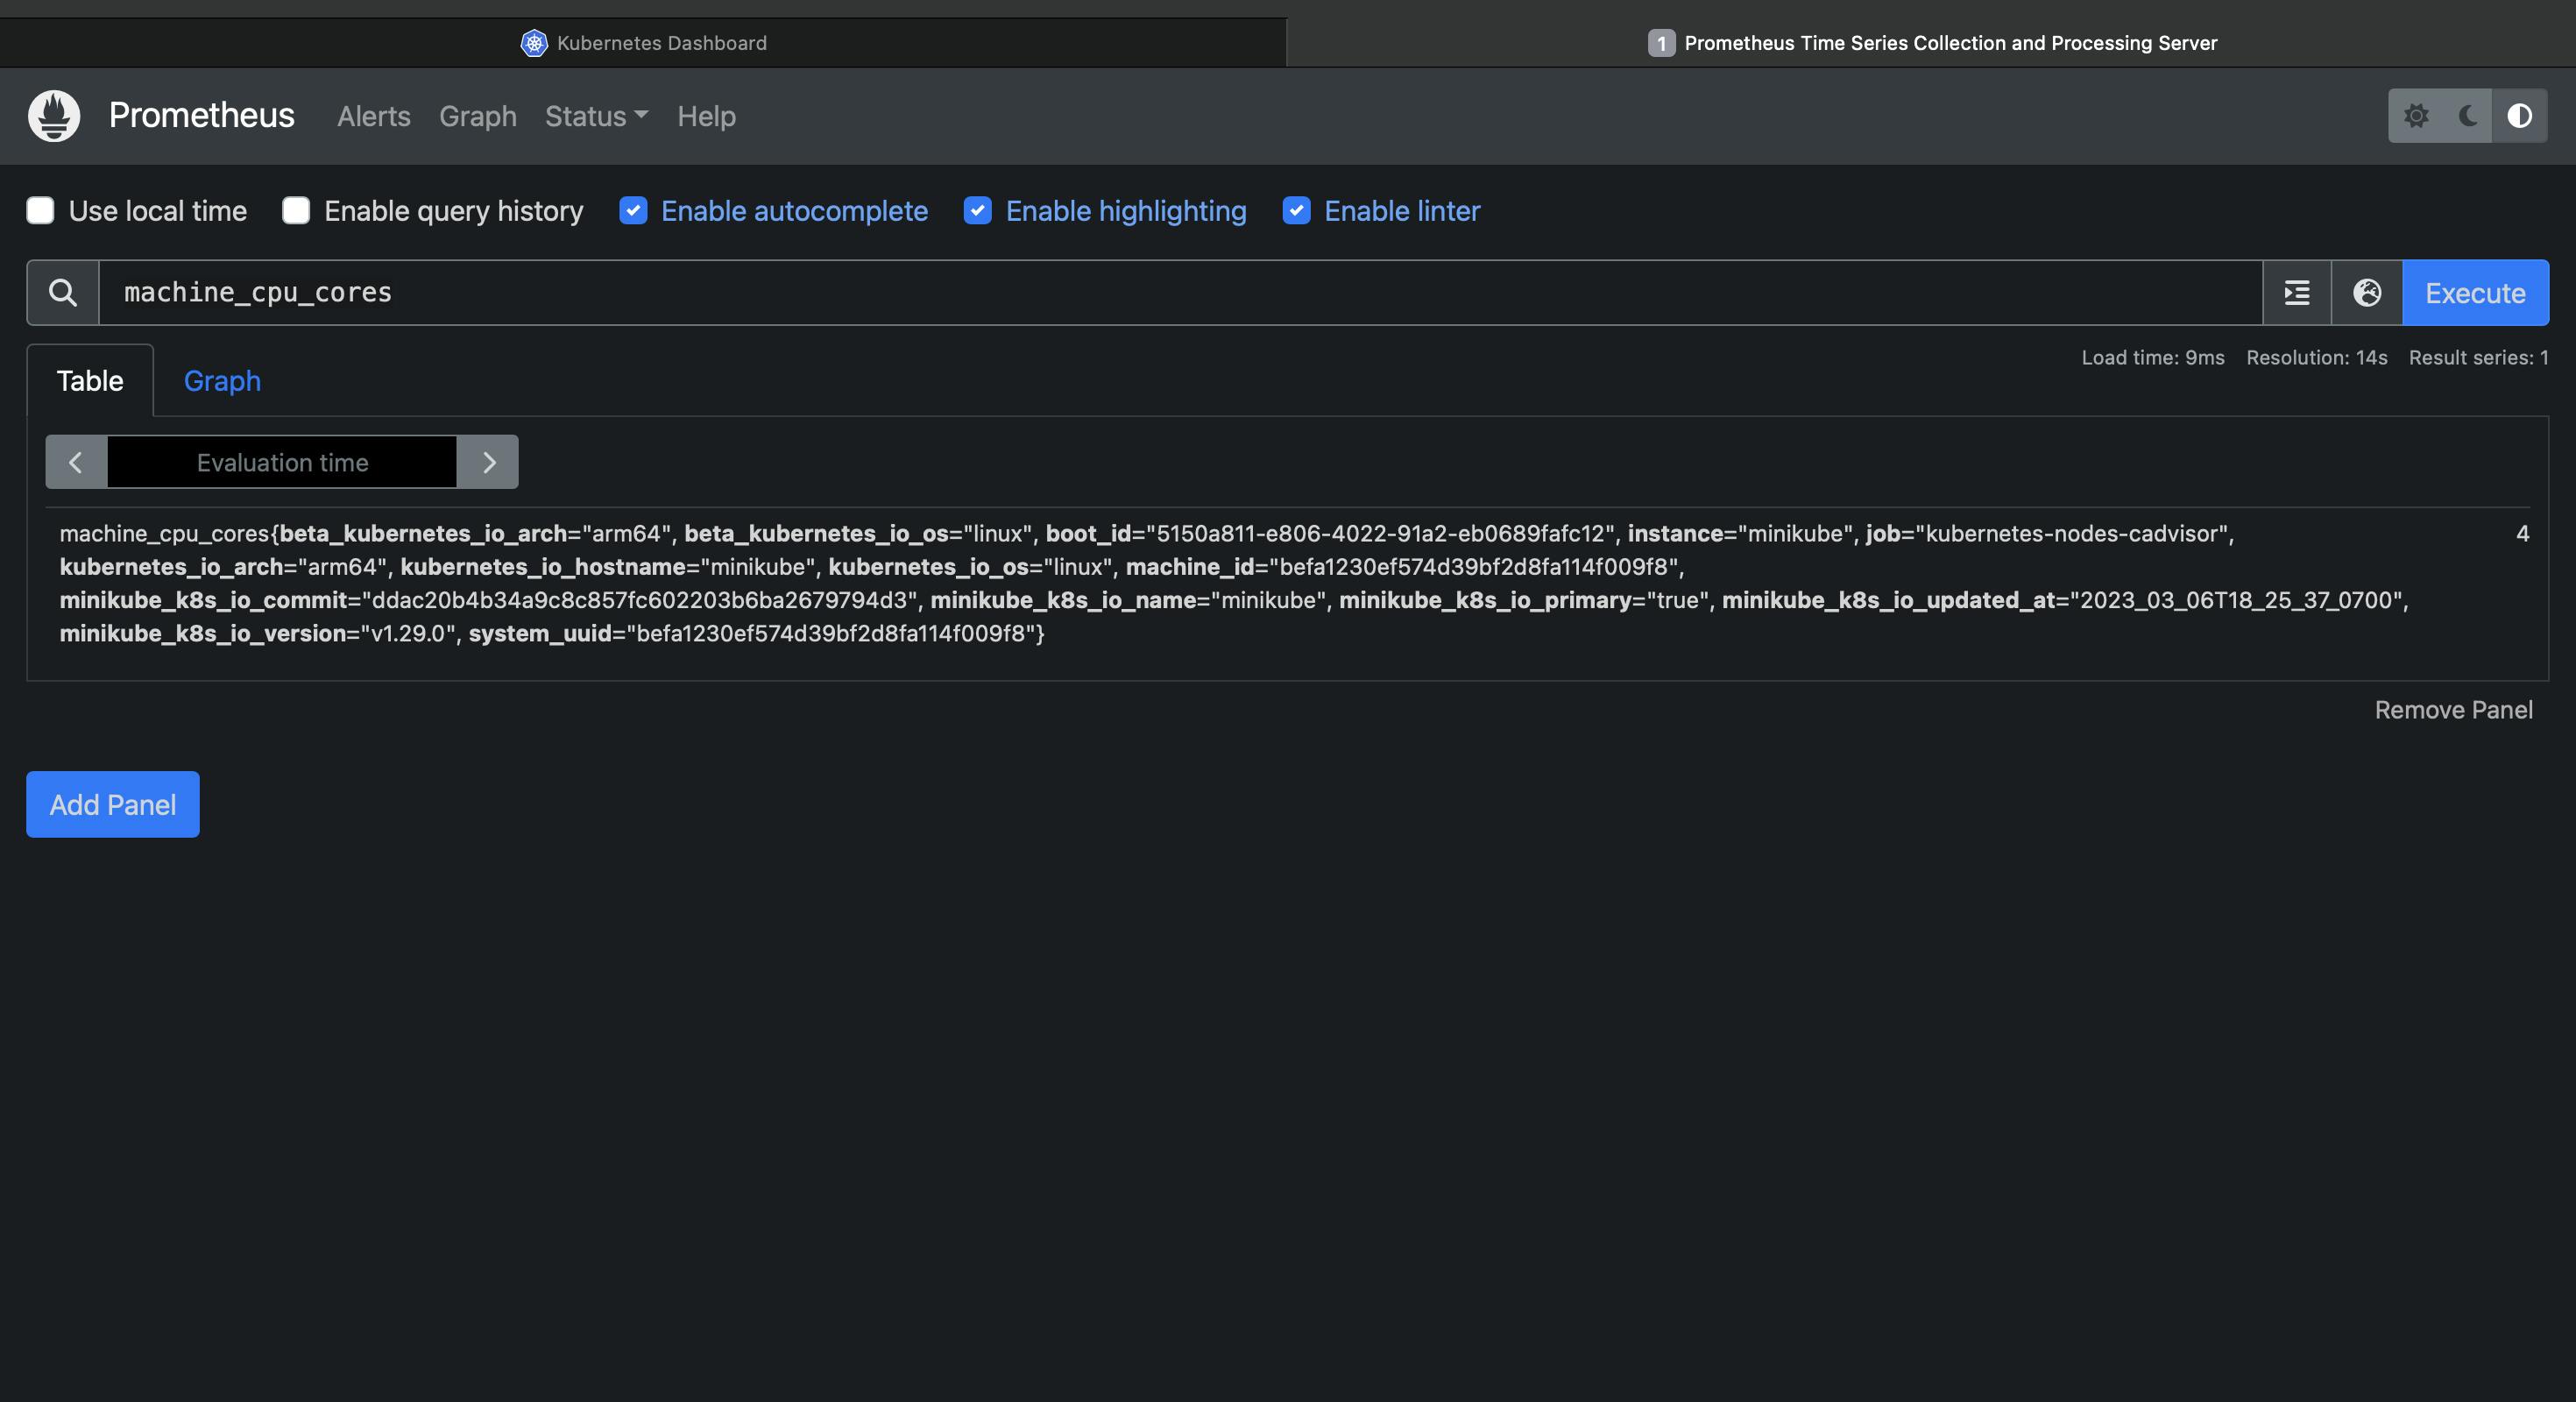
Similarly, you can try other metrics,

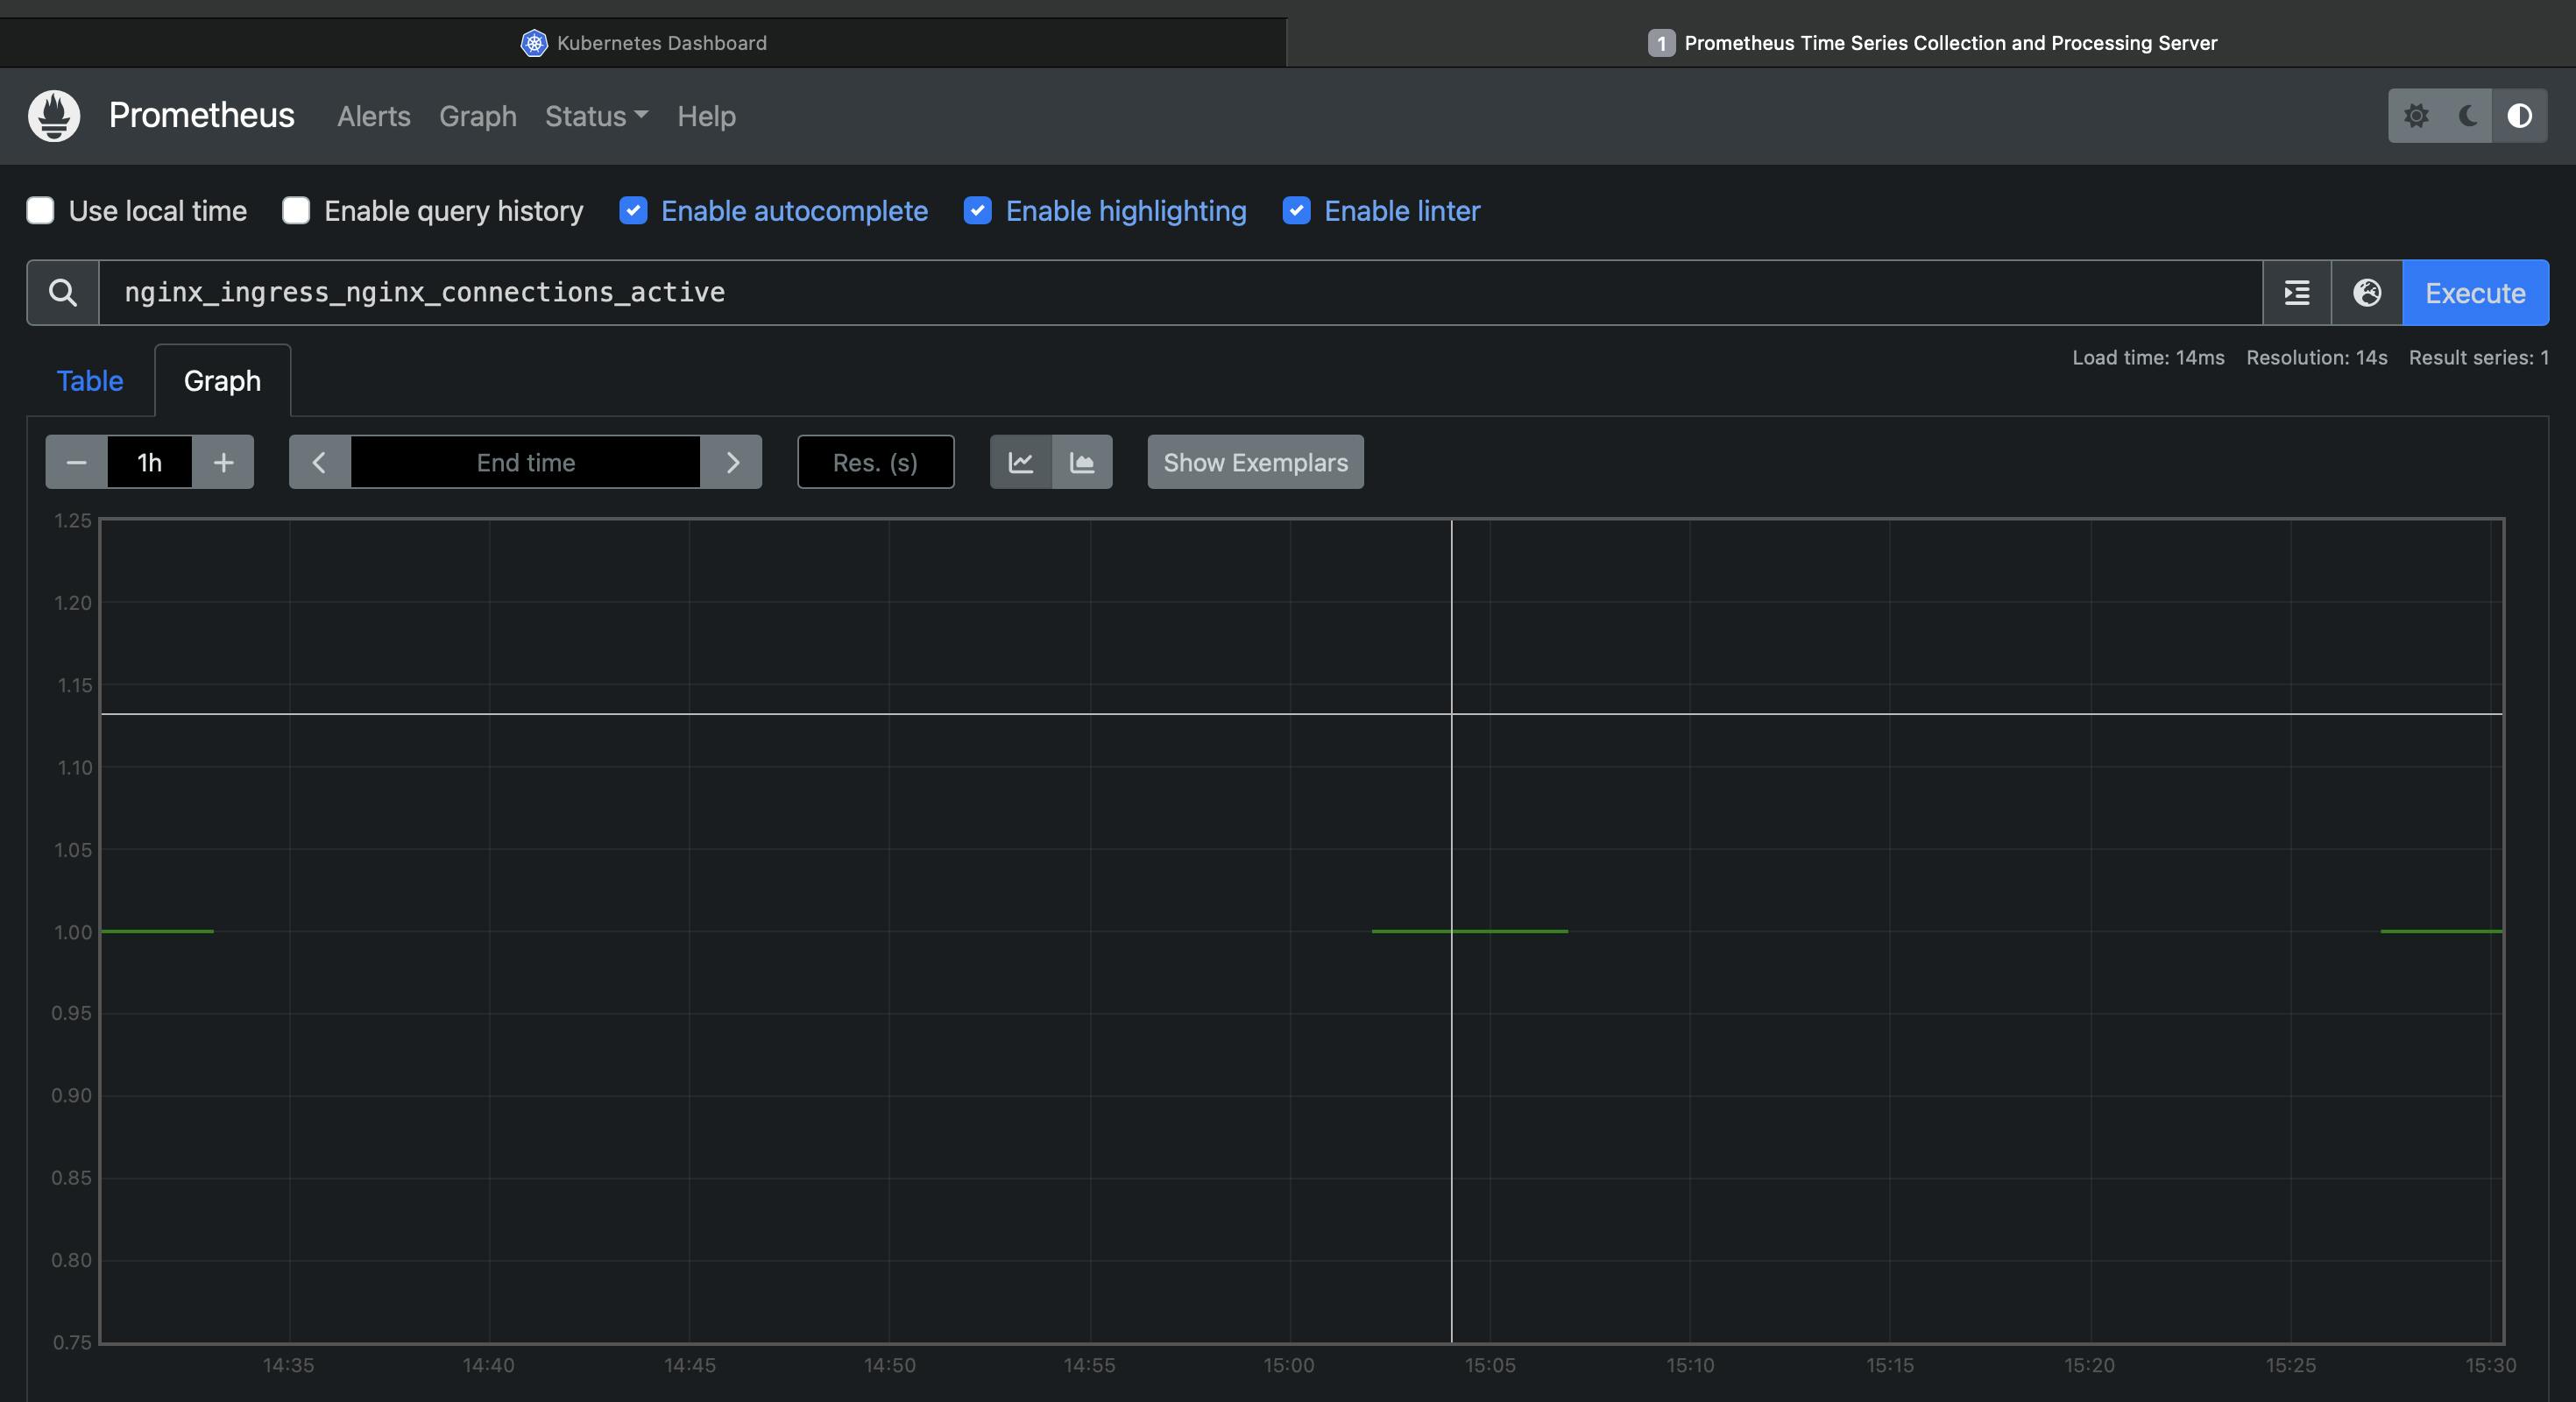
You can also view it as a graph:

It's sparsely populated because the number of requests on our application endpoint is only '1'.
In the next post, we'll see how to simulate multiple users requesting our application's endpoint using an open-source tool called 'Locust' which is primarily used for load testing.

