Integrate Locust into your K8s Project
An open source load testing tool written in Python.


Hi all, In the previous post we learned how to integrate Prometheus into our K8s project and monitor various metrics. In this post, we are going to use Locust from Locustio to simulate a traffic surge so we can watch NGINX Ingress Controller’s performance in Prometheus.
Prerequisites:
If you want to start from this point, you can clone my fox-game repo and follow the below steps to quickly get started:
#My directory structure looks like this:
├── k8s
└── src
    ├── bg
    │   ├── BUTTONS
    │   └── ICONS
    └── pet
Then Go inside the k8s/ and run the following commands:
$ minikube start
$ minikube addons enable metrics-server

# To create deployments:
$ kubectl apply -f k8s/deployment.yaml
$ kubectl apply -f k8s/service.yaml

# Install nginx using helm charts
$ helm repo add nginx-stable https://helm.nginx.com/stable
$ helm install main nginx-stable/nginx-ingress \
--set controller.watchIngressWithoutClass=true
$ kubectl apply -f ingress-class.yaml
$ kubectl apply -f ingress.yaml

# Install Prometheus using helm charts
$ helm repo add prometheus-community https://prometheus-community.github.io/helm-charts
$ helm install prometheus prometheus-community/prometheus


# To check creation of pods and services:
$ kubectl get pods
$ kubectl get svc

# You can also check from minikube dashboard. To launch minikube dashboard:
$ minikube dashboard
Step 1: Create locust.yaml file in k8s/ folder.
apiVersion: v1
kind: ConfigMap
metadata:
  name: locust-script
data:
  locustfile.py: |-
    from locust import HttpUser, task, between
    class QuickstartUser(HttpUser):
        wait_time = between(0.7, 1.3)
        @task
        def hello_world(self):
            self.client.get("/", headers={"Host": "raisethefox.com"})
---
apiVersion: apps/v1
kind: Deployment
metadata:
  name: locust
spec:
  selector:
    matchLabels:
      app: locust
  template:
    metadata:
      labels:
        app: locust
    spec:
      containers:
        - name: locust
          image: locustio/locust
          ports:
            - containerPort: 8089
          volumeMounts:
            - mountPath: /home/locust
              name: locust-script
          resources: {}
      volumes:
        - name: locust-script
          configMap:
            name: locust-script
---
apiVersion: v1
kind: Service
metadata:
  name: locust
spec:
  ports:
    - port: 8089
      targetPort: 8089
      nodePort: 30015
  selector:
    app: locust
  type: LoadBalancer
In case you're wondering, we can definitely define different types of documents (like Deployment, Service, ConfigMap, etc.) in one yaml file separated by ---
See here to learn more about YAML
ConfigMap : ConfigMap is a similar API resource to Secrets, except the data, is not encoded. They store data as sets of key-value pairs or plain configuration files in any format.
A ConfigMap can be used in several different ways. A container can use the data as environmental variables from one or more sources. The values contained inside can be passed to commands inside the pod.
Let's say you have a file on your local filesystem called config.js. You can create a ConfigMap that contains this file. The configmap object will have a data section containing the content of the file.
For more info on ConfigMaps see here.
apiVersion: v1
kind: ConfigMap
metadata:
    name: foobar
data:
    config.js: |
         {
...
Step 2: Deploy locust.yaml
$ kubectl apply -f k8s/locust.yaml
# Output
configmap/locust-script created
deployment.apps/locust created
service/locust created
Step 3: Open a new terminal and run nginx service.
$ minikube service main-nginx-ingress-controller
# keep this terminal open
Step 4: Open a new terminal and run prometheus-server.
$ minikube service prometheus-server
# keep this terminal open
Step 5: Open a new terminal and run locust service.
$ minikube service locust
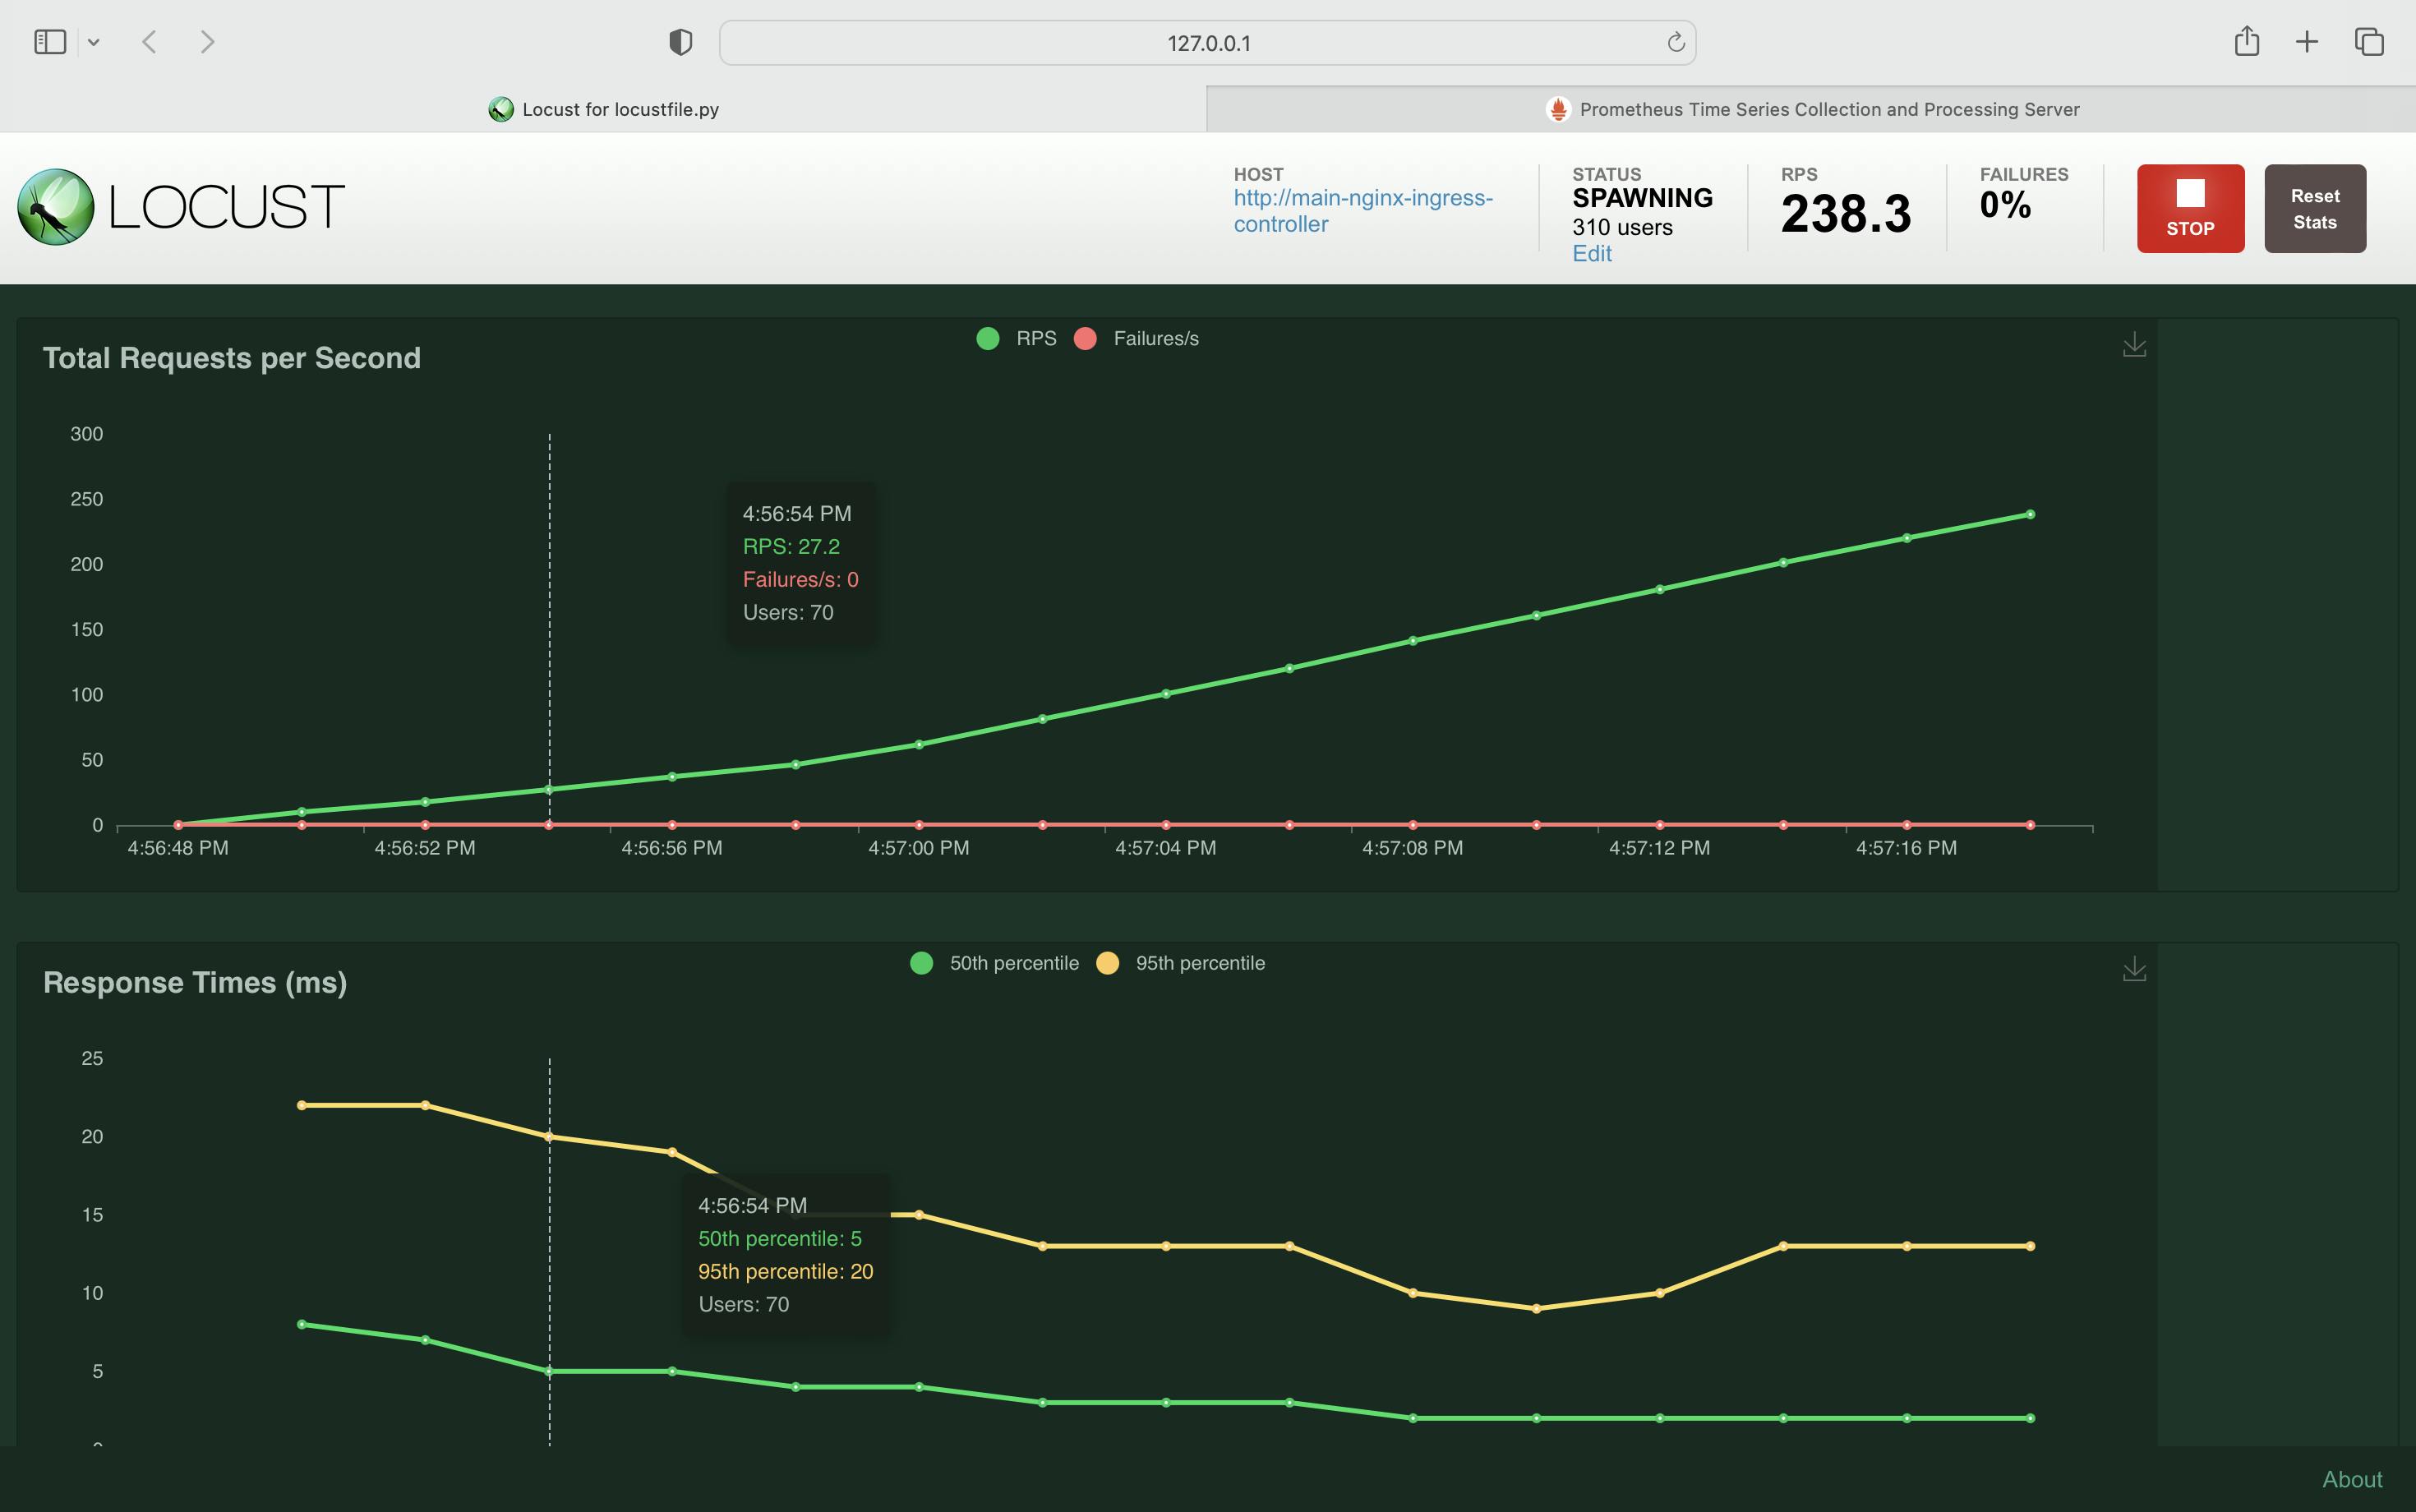
Step 6: Simulate a Traffic Surge and Observe the Effect on Performance
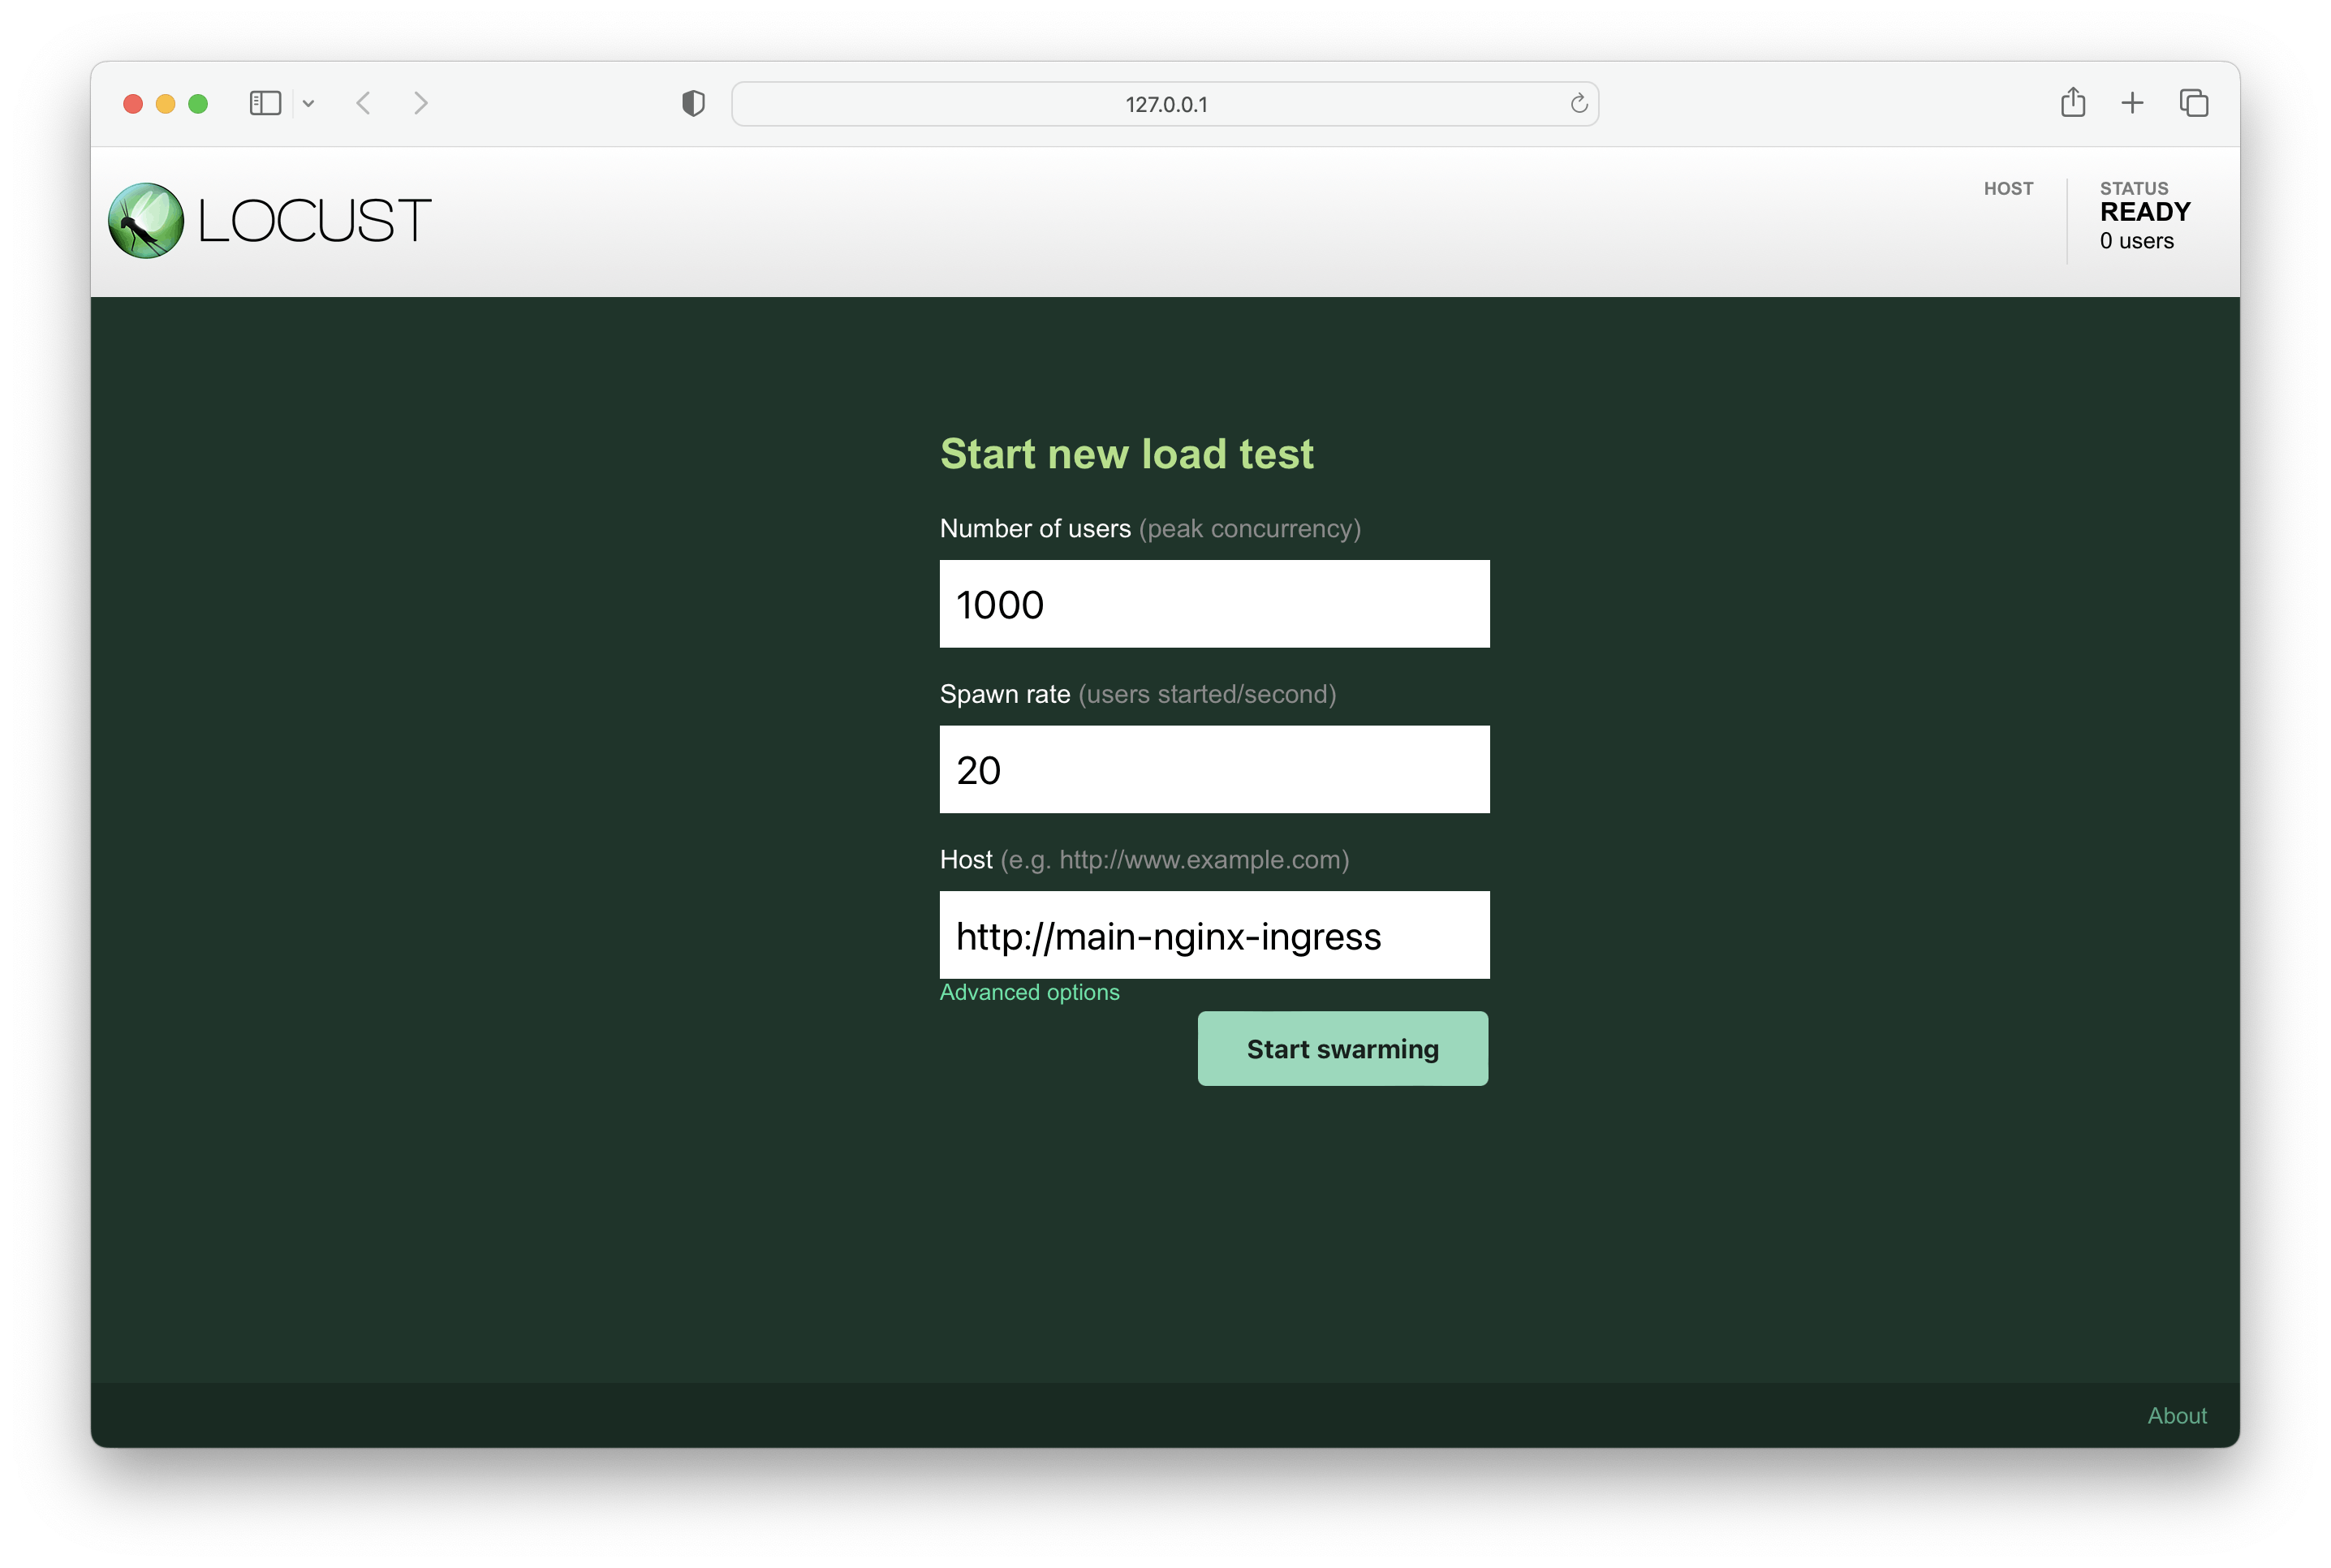
Enter the following values in the fields:
Number of users – 1000
Spawn rate – 20
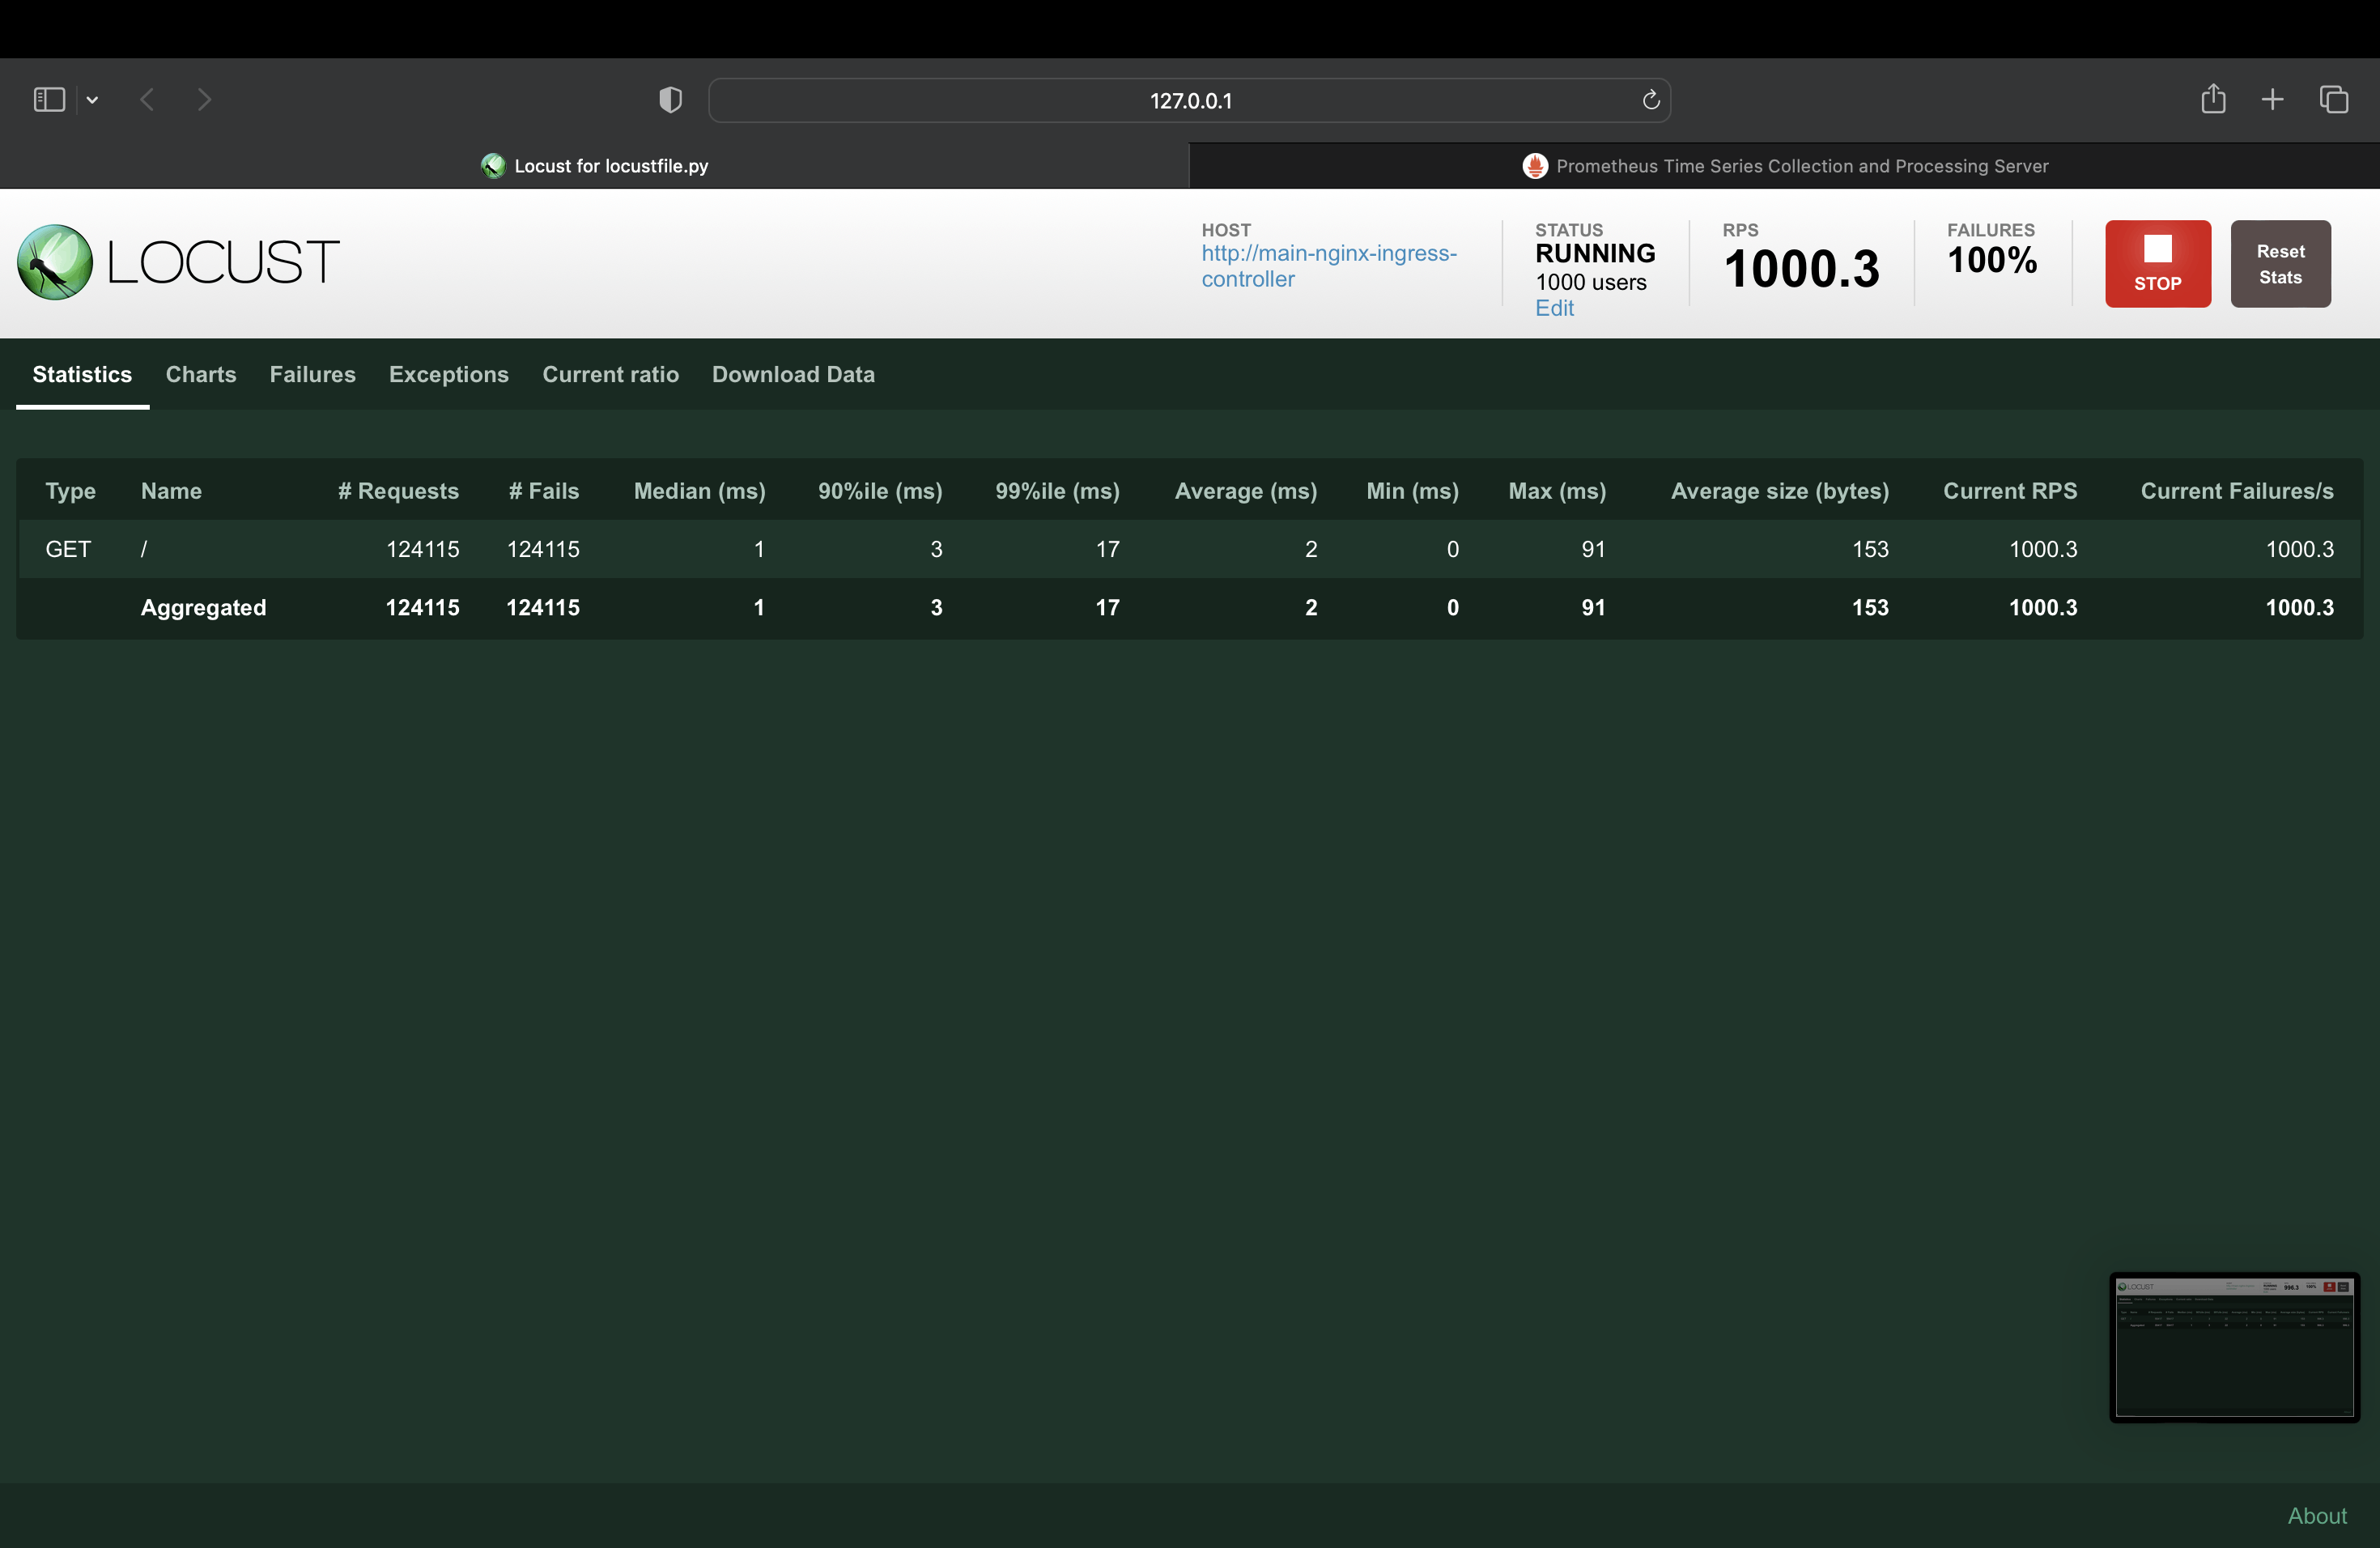
The results would look like this:
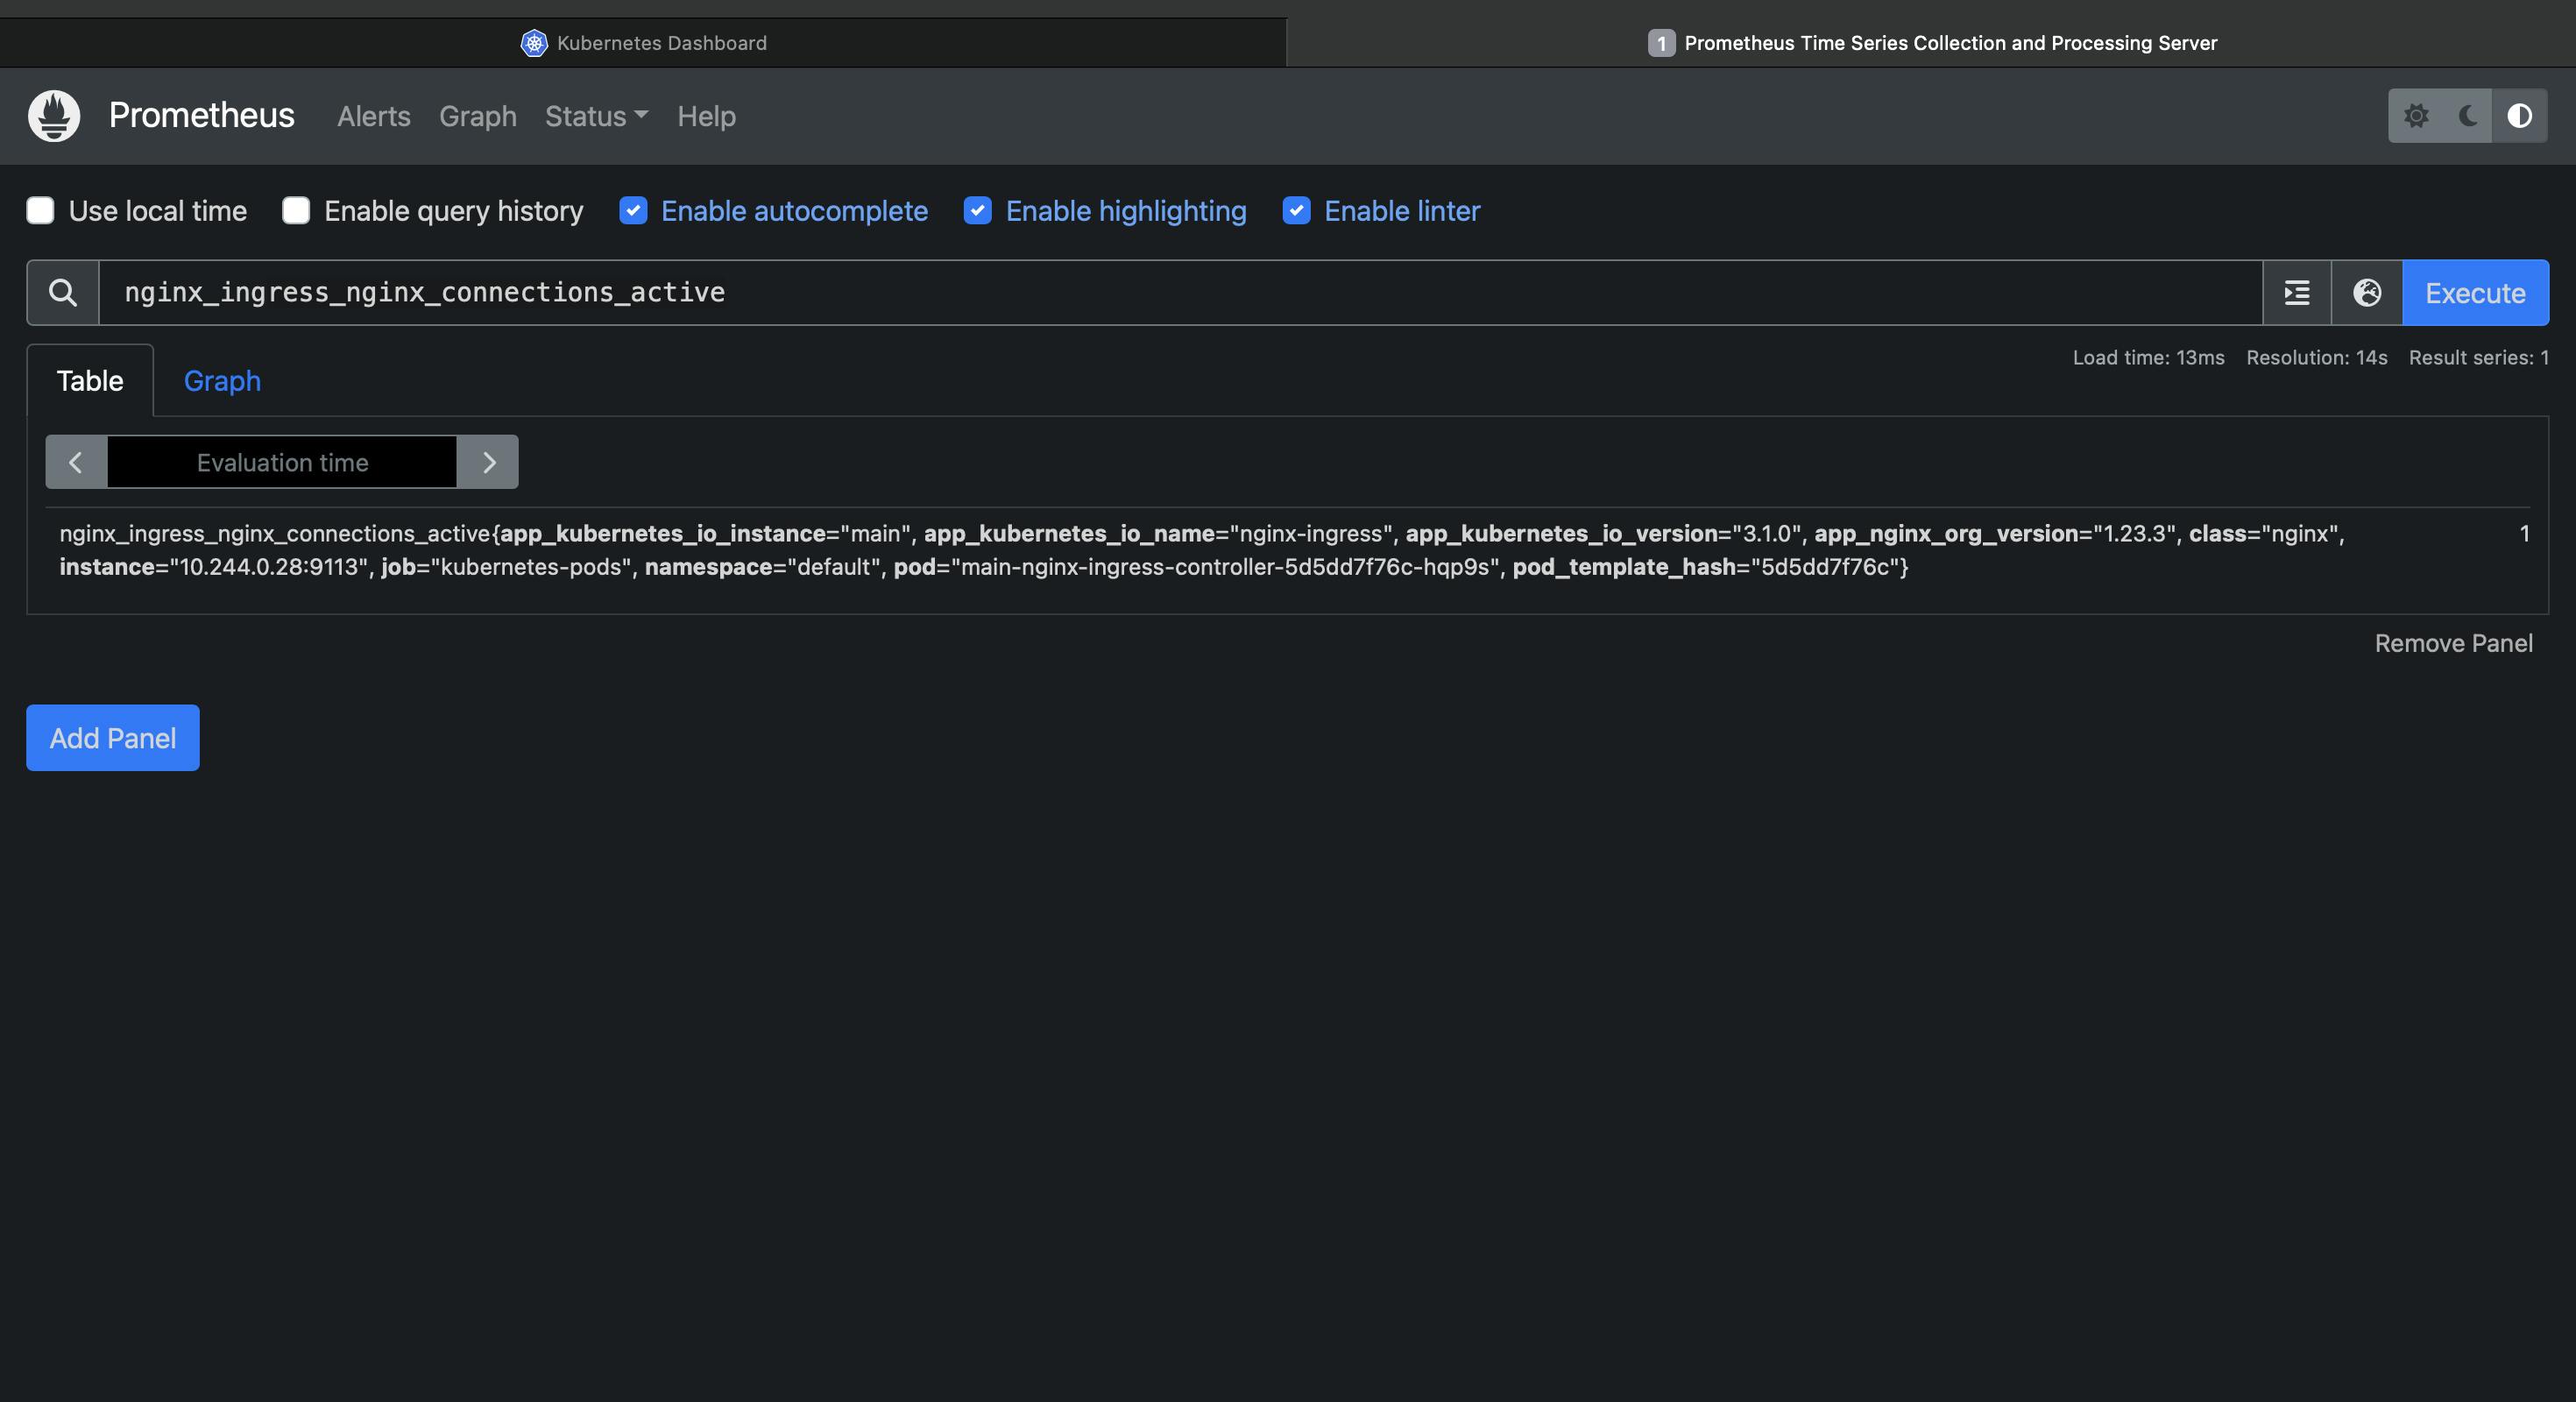
Search for nginx_ingress_nginx_connections_active to see
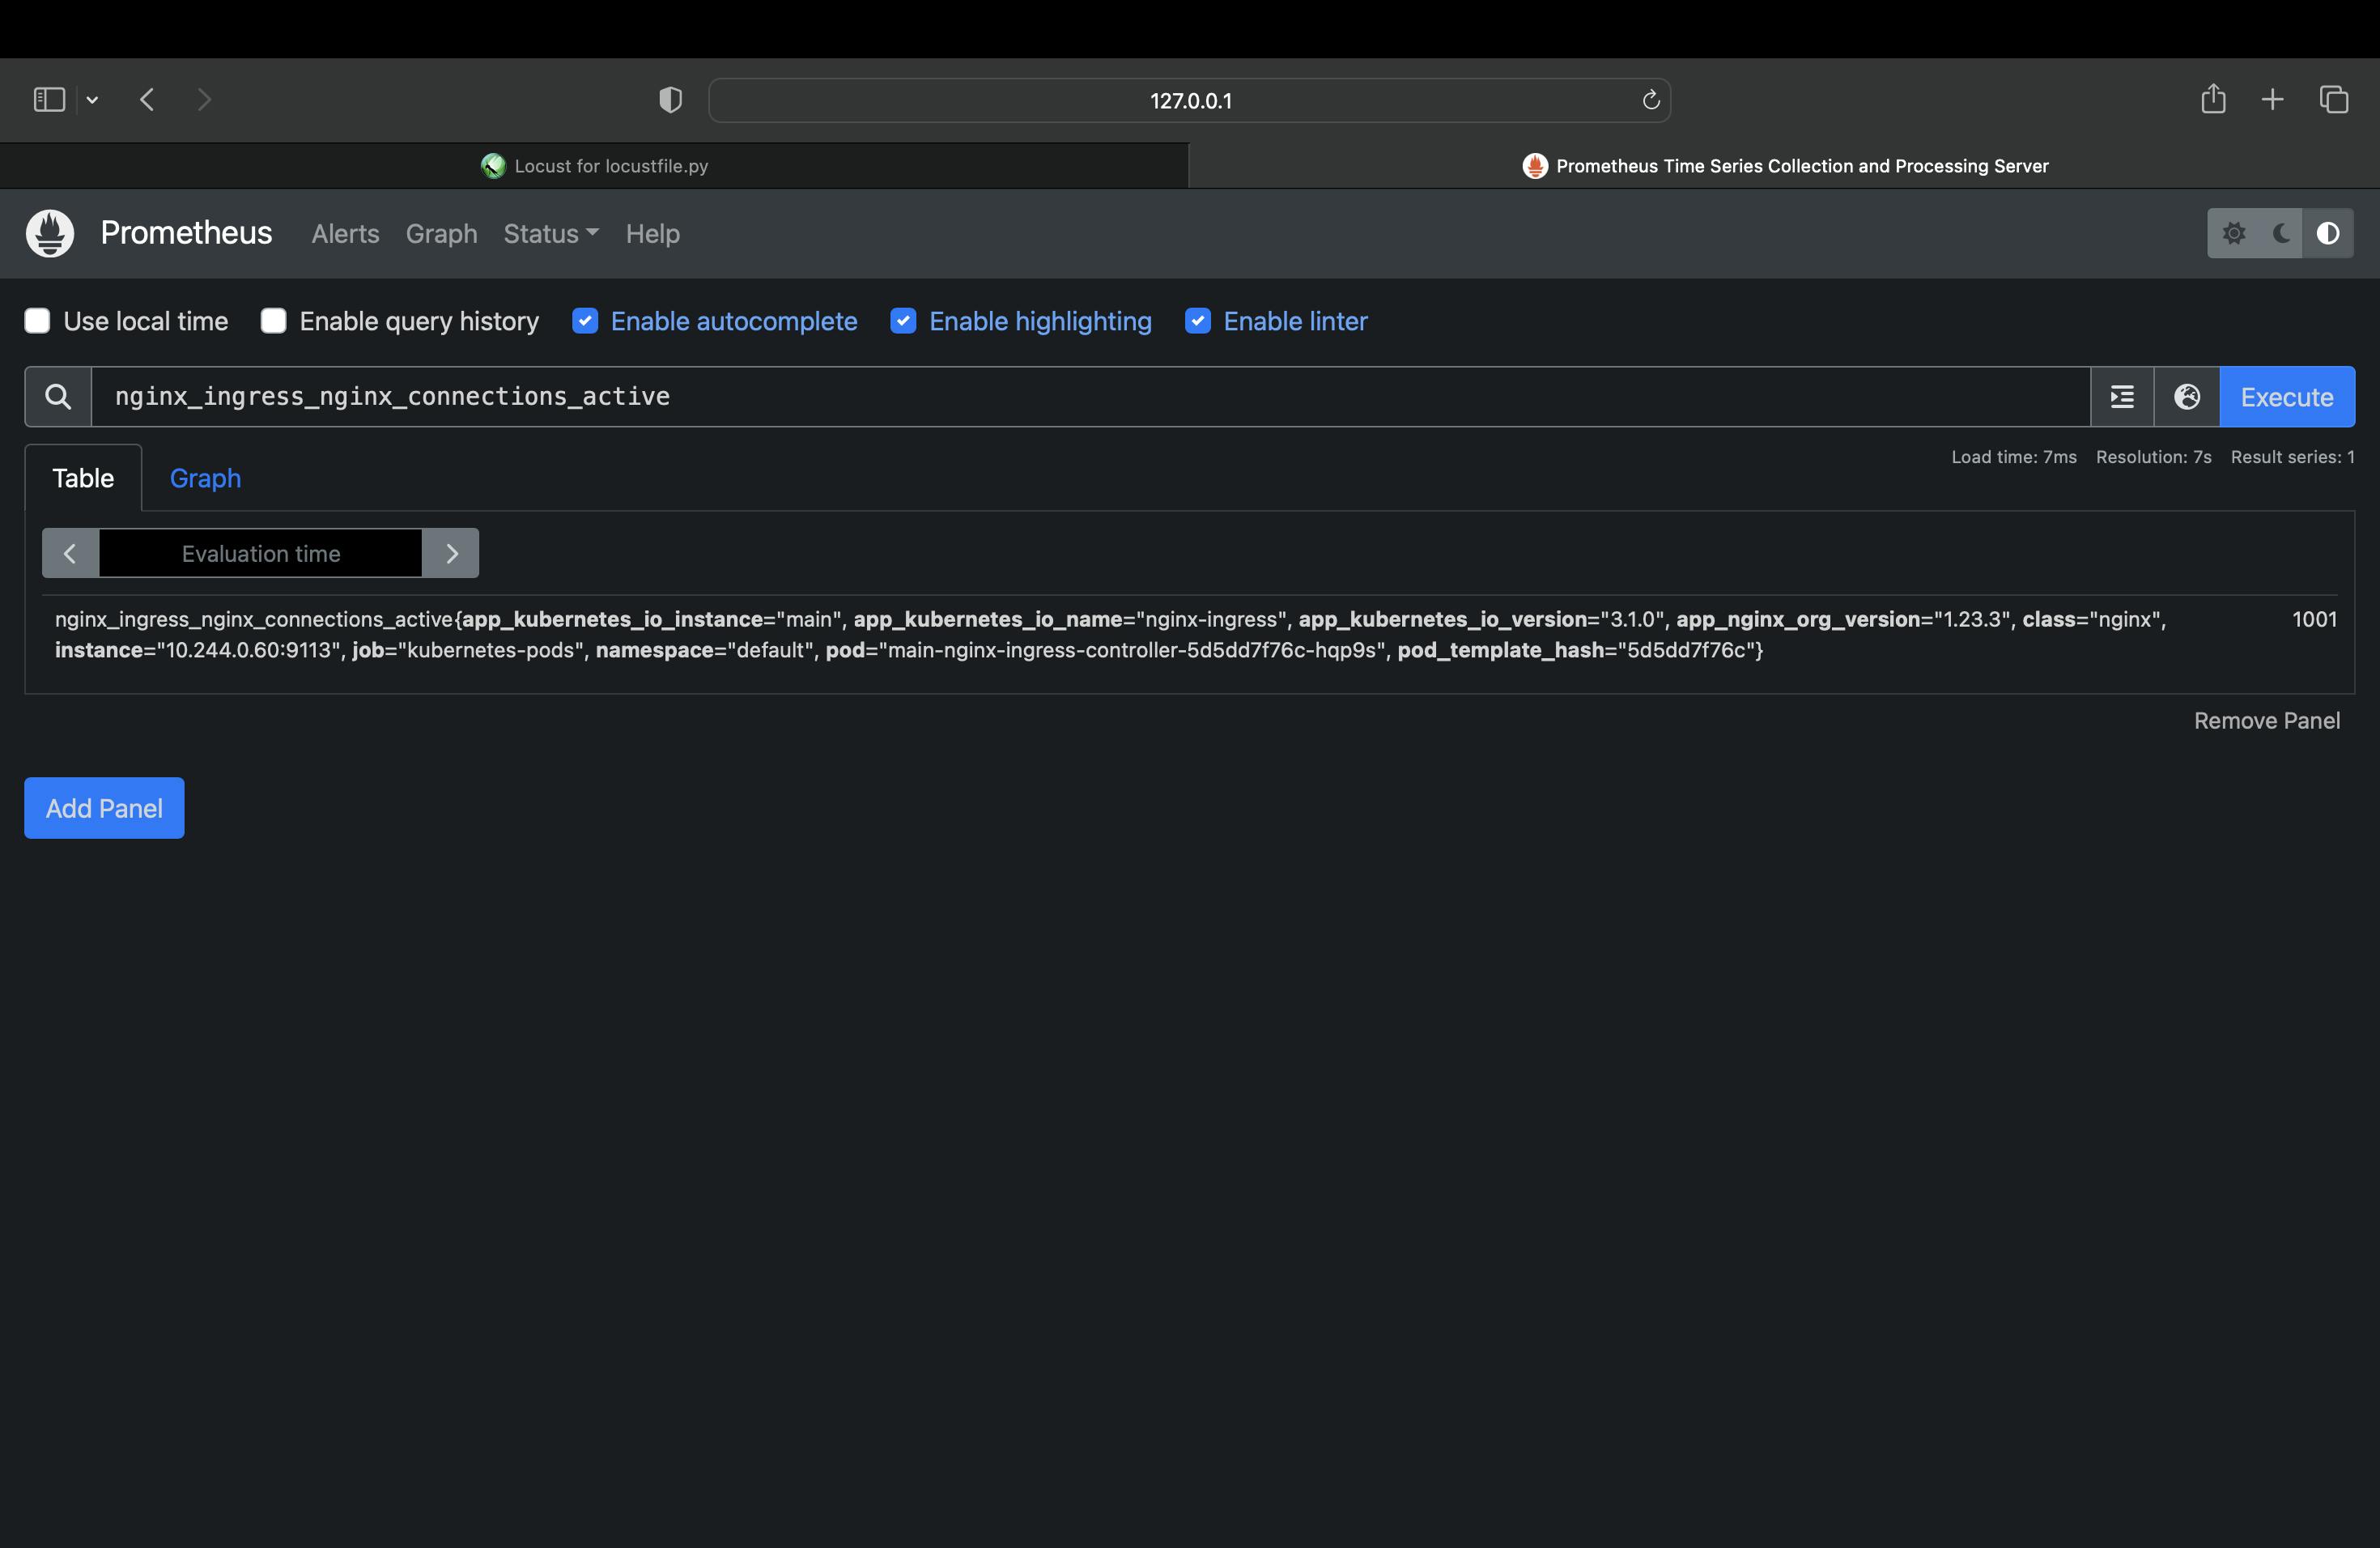
As the result shows, the single NGINX Ingress Controller pod struggles to process the increased traffic without latency as a large number of connections are established. The Prometheus graph reveals that about 1000 active connections per NGINX Ingress Controller pod is the tipping point for a spike in latency.
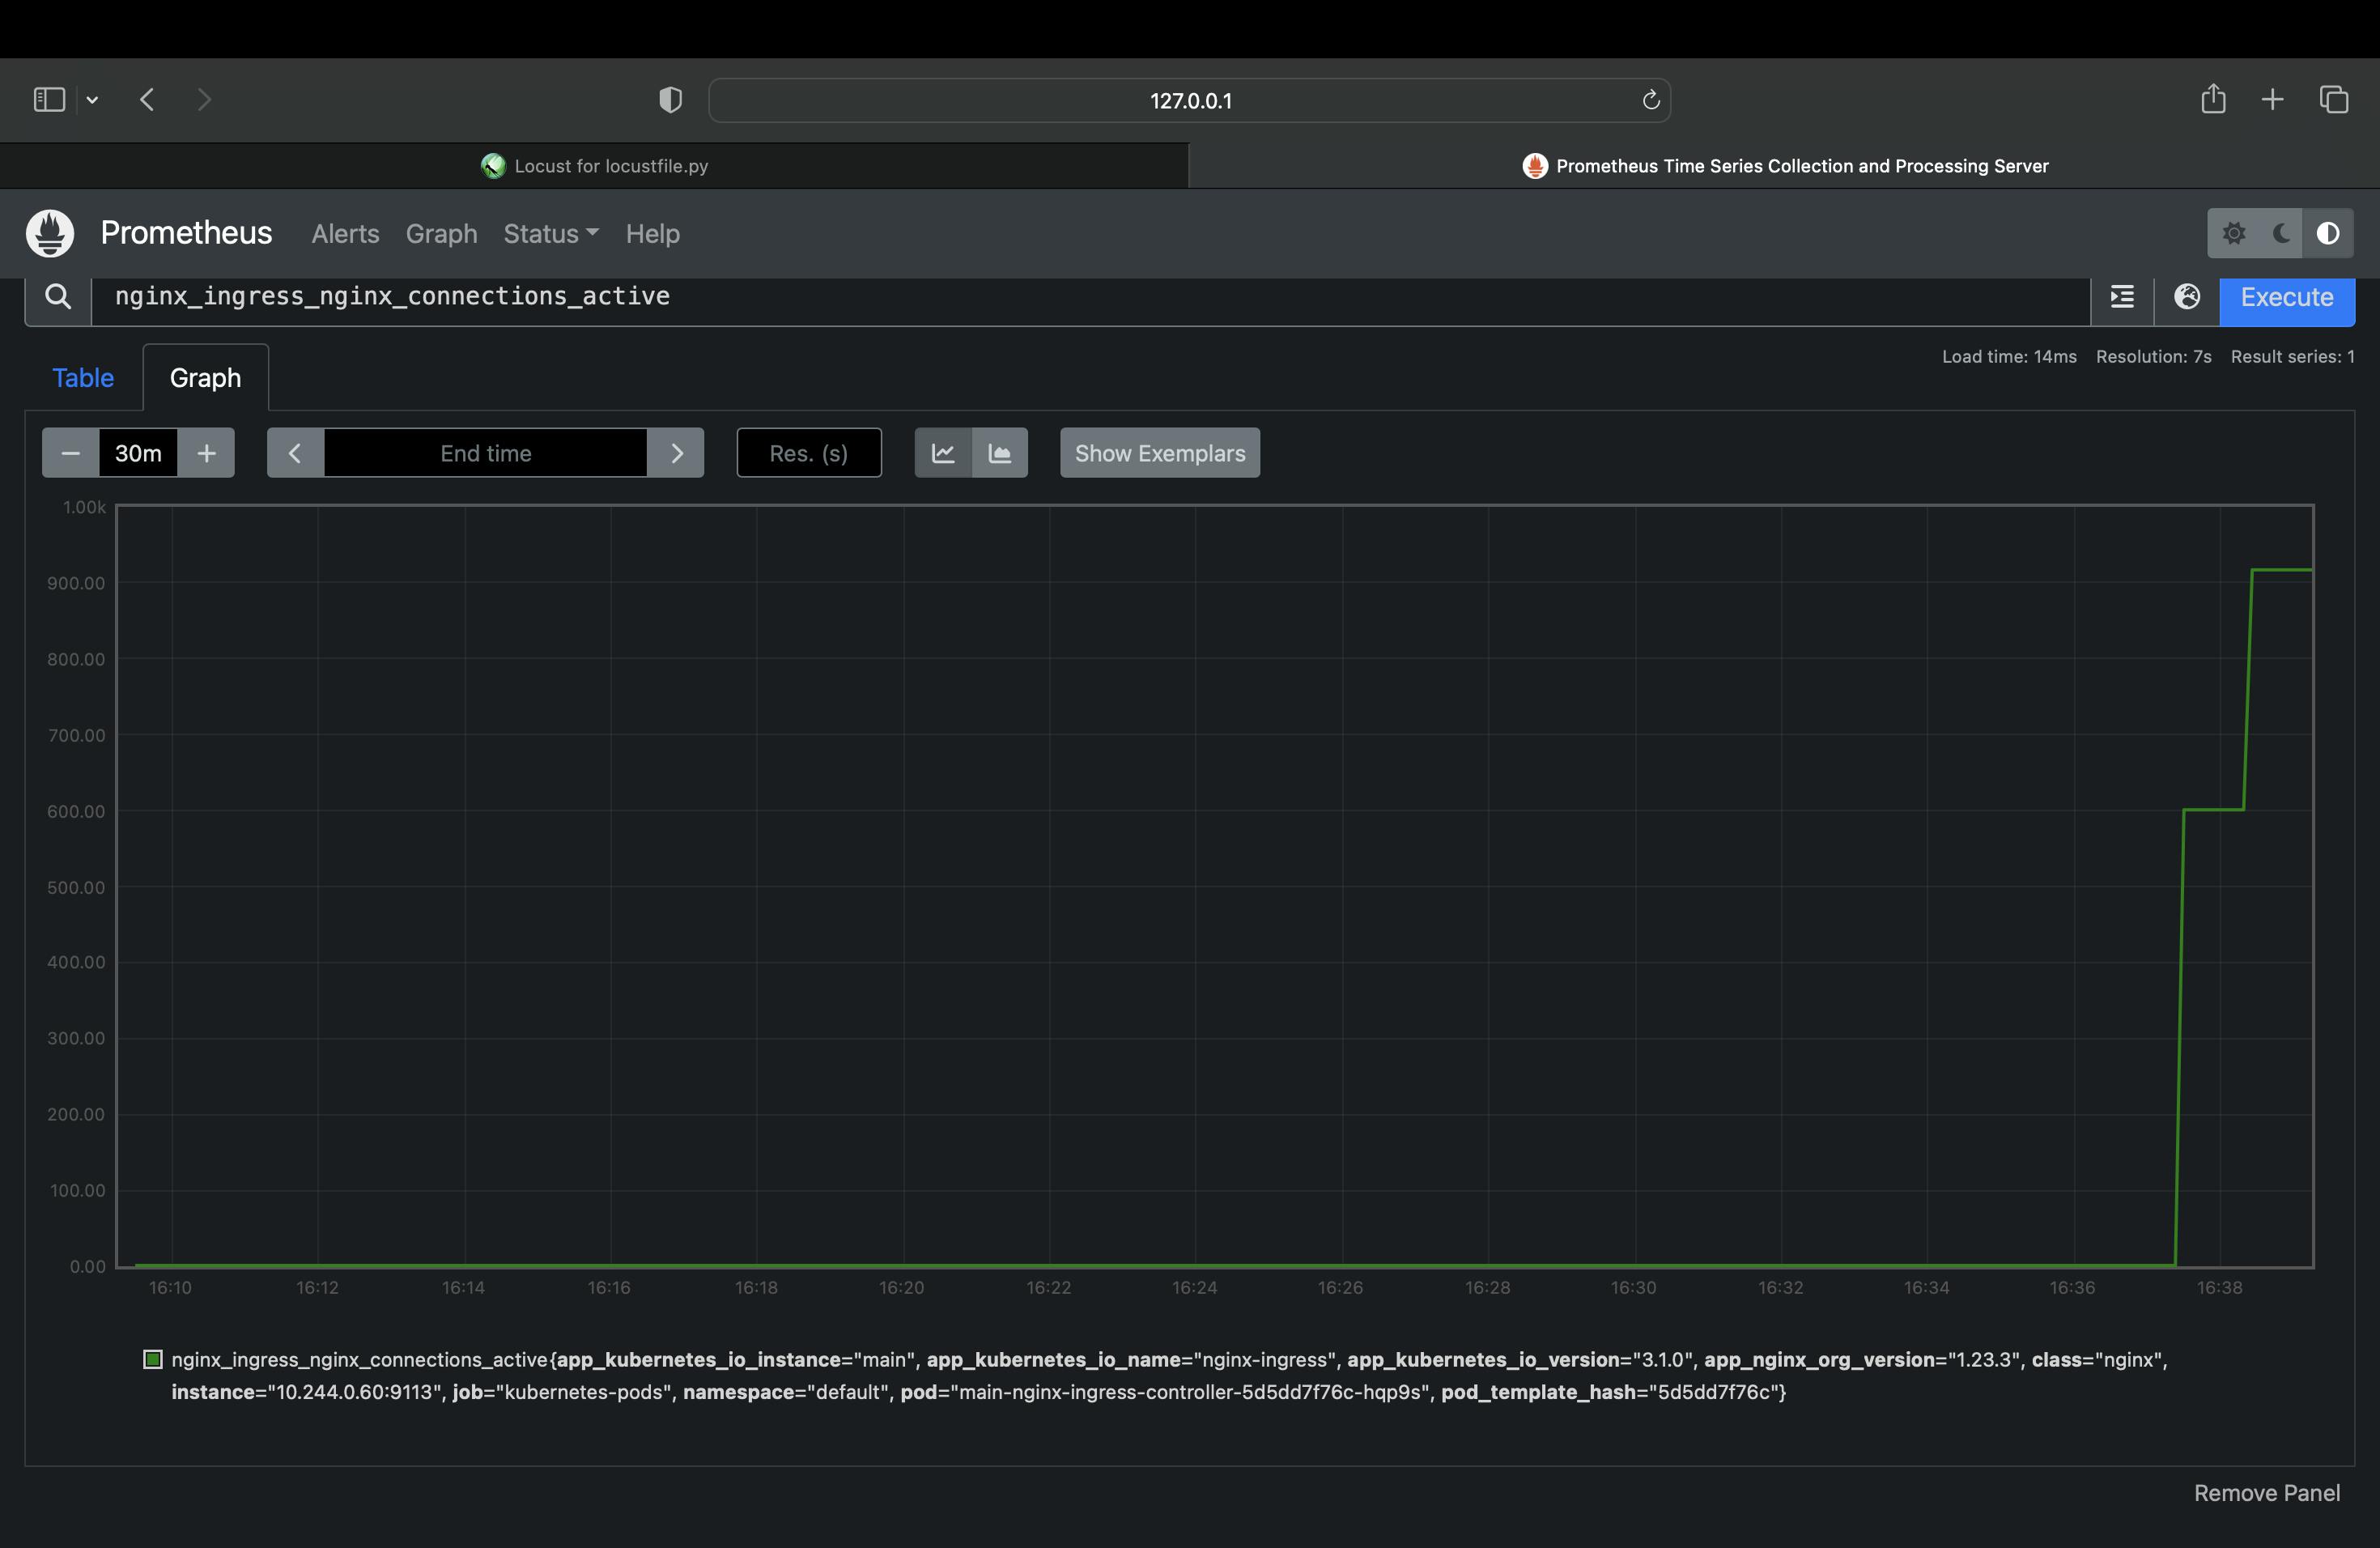
We can use this information to determine when we need to scale up the number of NGINX Ingress Controller pods to avoid increased latency.
This we will see in the next post. Stay tuned :)